
 Well, that was a nice try.
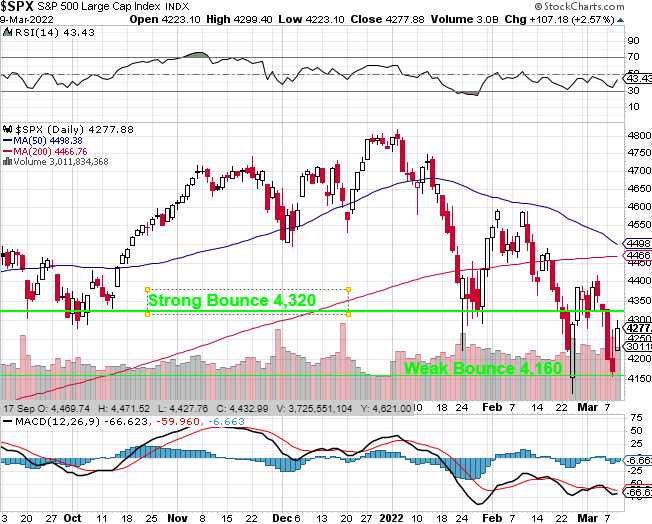
Yodi wanted pictures so here's the S&P's bounce lines. We haven't actually hit the 20% correction mark at 4,000 but, as long as we're stuck in the range betwwen the weak and strong bounce lines – we're most likely consolidating for a move lower The bulls hope we're going to form the 4th leg of a "W" pattern here and recover back to 4,550 but we're already in a broken "W" pattern off the Strong Bounce Line and conditions haven't changed (worse, actually) so why should this time be different?
Also note, as we predicted in our Live Trading Webinar last month, we're about to hit that "Death Cross" on the S&P 500 and that is BAD. Even though we could see it from literally a mile (and a month) away, it will still come as a surprise to traders and analysts, who use TA completely wrong on a mass scale. As I said at the time, if you understand HOW a chart is made, then you can predict what it will look like in the future. If you are GUESSING where the market will go based on the chart you see - you're doing it wrong.
Very simply, the 50-day moving average changes slower than the 200-day moving average and "slower" isn't just some vague notion – it does, in FACT, change at a pace that is 25% slower than the 50-day moving average so every day the market closes below the 200-day moving average, it drags the 50-day moving average 4x lower than it does the 200-day. Therefore, we KNOW how many days it will take before we get our crosses long, long in advance.
What does the Future hold? Well we have the Fed Meeting next week and inflation is out of control so it's not at all likely they don't hike at all and the market expects 0.25% and 0.5% would be a big negative – so there's no likely positive there. We also have PPI, Retail Sales, Housing Starts, Industrial Production and the NY and Philly Fed – hard to see any of those things popping us over the 200 dma so, if we assume we have another 7 trading days below the 200 dma – that is likely to pull the 50 dma…
