
Footwear, apparel, and accessories retailer Genesco (NYSE: GCO) reported Q4 CY2025 results topping the market’s revenue expectations, with sales up 7.2% year on year to $799.9 million. Its non-GAAP profit of $3.74 per share was 4.3% above analysts’ consensus estimates.
Is now the time to buy Genesco? Find out by accessing our full research report, it’s free.
Genesco (GCO) Q4 CY2025 Highlights:
- Revenue: $799.9 million vs analyst estimates of $787 million (7.2% year-on-year growth, 1.6% beat)
- Adjusted EPS: $3.74 vs analyst estimates of $3.59 (4.3% beat)
- Adjusted EPS guidance for the upcoming financial year 2027 is $2.10 at the midpoint, beating analyst estimates by 8.7%
- Operating Margin: 6.4%, in line with the same quarter last year
- Locations: 1,236 at quarter end, down from 1,278 in the same quarter last year
- Same-Store Sales rose 9% year on year (10% in the same quarter last year)
- Market Capitalization: $281.6 million
Mimi E. Vaughn, Genesco’s Board Chair, President and Chief Executive Officer, said, "We are very pleased to close out Fiscal 2026 with another quarter of strong performance, highlighted by our sixth consecutive quarter of positive comparable sales growth, demonstrating the sustainability of our momentum, combined with a meaningful increase in profitability. Journeys once again led the way with double-digit comp growth on top of double digits last year, fueled by an exceptional holiday performance. Our strategic initiatives around product elevation and customer experience continue to resonate with teens, driving market share gains and positioning Journeys as the clear destination for style-led footwear. At the same time, Johnston & Murphy’s comparable sales improved in each successive month, while Schuh navigated a promotional U.K. environment and exited the year with clean inventories.”
Company Overview
Spanning a broad range of styles, brands, and prices, Genesco (NYSE: GCO) sells footwear, apparel, and accessories through multiple brands and banners.
Revenue Growth
Reviewing a company’s long-term sales performance reveals insights into its quality. Any business can have short-term success, but a top-tier one grows for years. Regrettably, Genesco’s sales grew at a weak 6.4% compounded annual growth rate over the last five years. This was below our standard for the consumer discretionary sector and is a poor baseline for our analysis.
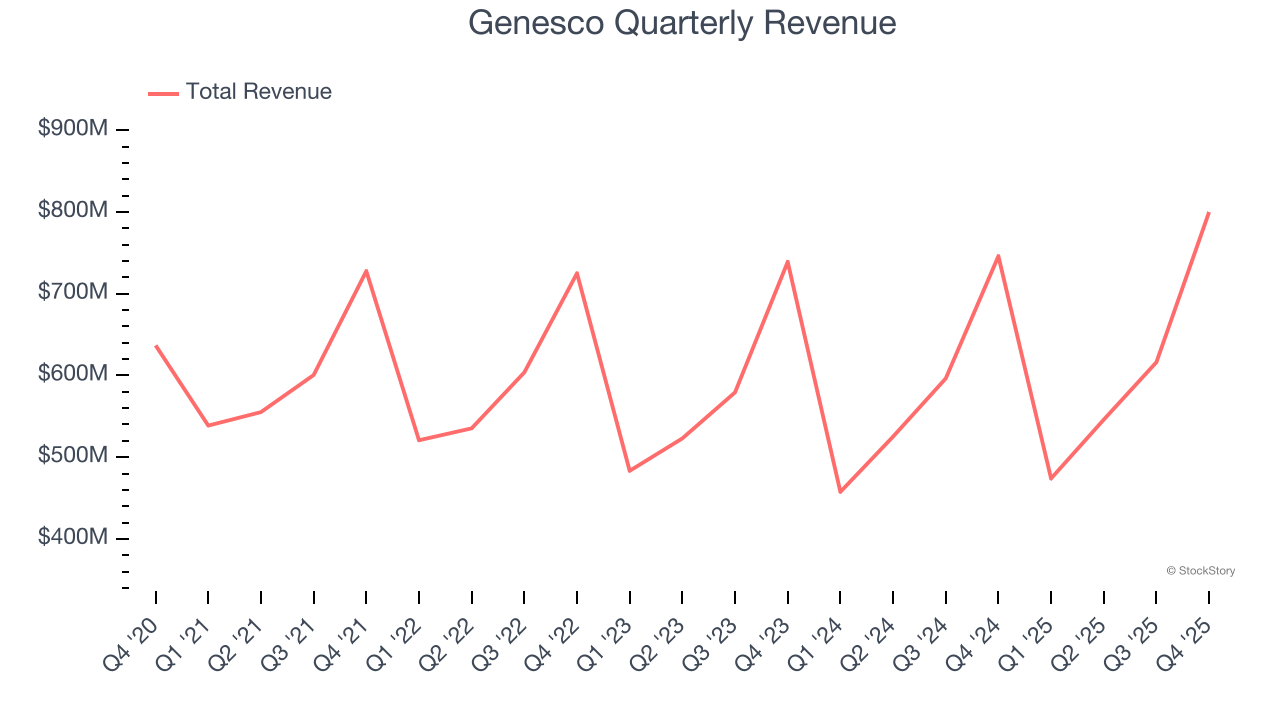
We at StockStory place the most emphasis on long-term growth, but within consumer discretionary, a stretched historical view may miss a company riding a successful new product or trend. Genesco’s recent performance shows its demand has slowed as its annualized revenue growth of 2.4% over the last two years was below its five-year trend. We’re wary when companies in the sector see decelerations in revenue growth, as it could signal changing consumer tastes aided by low switching costs. 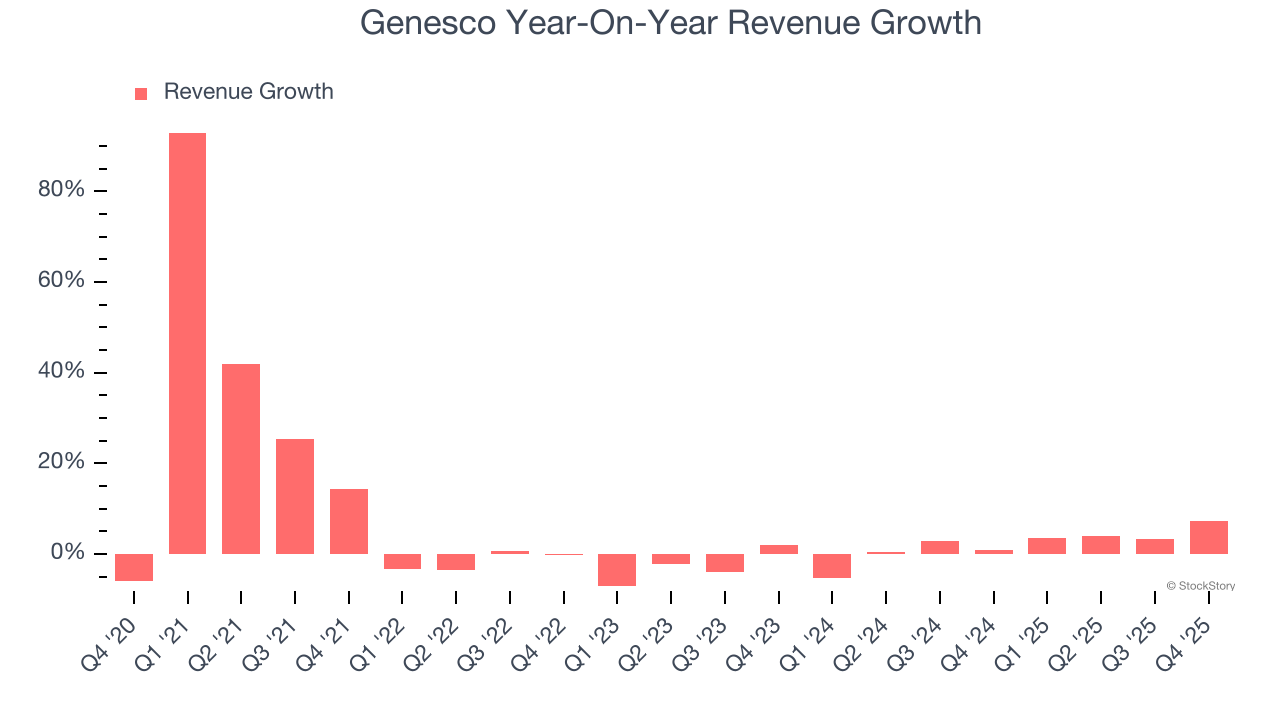
Genesco also reports same-store sales, which show how much revenue its established locations generate. Over the last two years, Genesco’s same-store sales averaged 3.8% year-on-year growth. This number doesn’t surprise us as it’s in line with its revenue growth. 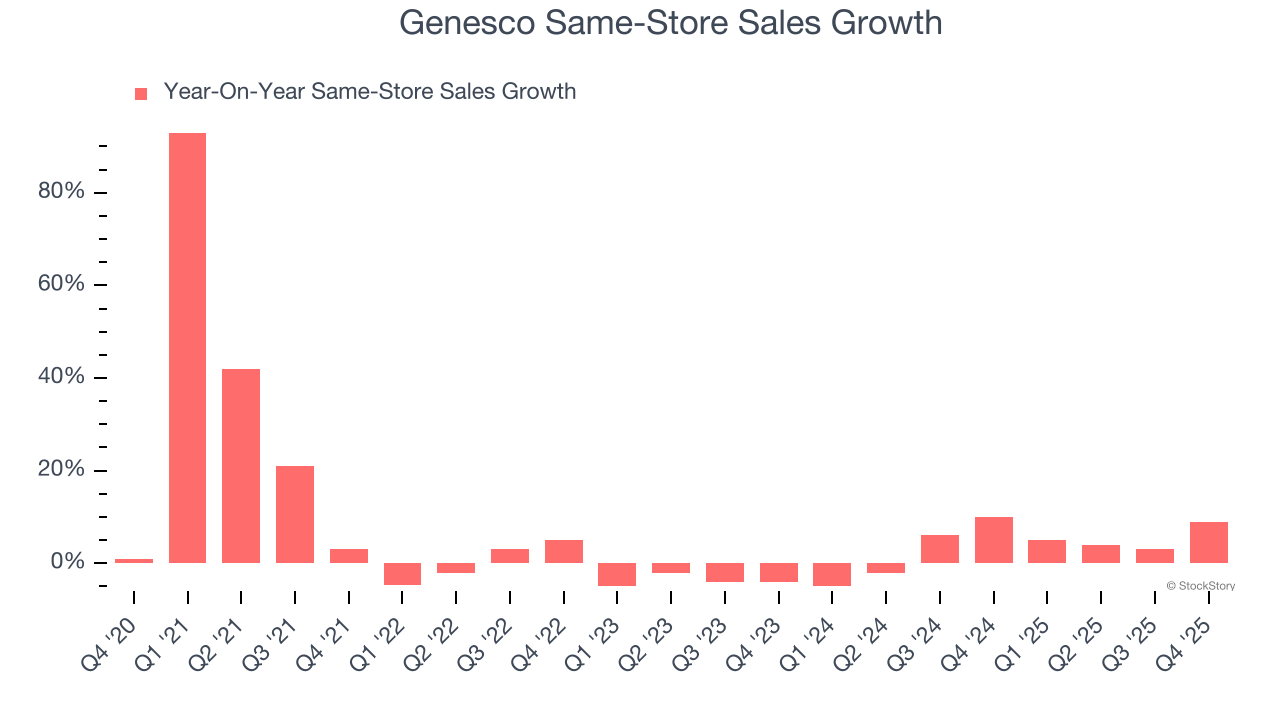
This quarter, Genesco reported year-on-year revenue growth of 7.2%, and its $799.9 million of revenue exceeded Wall Street’s estimates by 1.6%.
Looking ahead, sell-side analysts expect revenue to remain flat over the next 12 months, a slight deceleration versus the last two years. This projection is underwhelming and indicates its products and services will see some demand headwinds.
WHILE YOU’RE HERE: The Next Palantir? One satellite company captures images of every point on Earth. Every single day. The Pentagon wants it. Hedge funds are using it to beat earnings. You’ve probably never heard of it.
This is what the early days of Palantir looked like before it became a $437 billion giant. Same playbook. Different technology. If you missed Palantir, you need to see this. Claim The Stock Ticker for Free HERE.
Operating Margin
Genesco’s operating margin has generally stayed the same over the last 12 months. The company broke even over the last two years, inadequate for a consumer discretionary business. Its large expense base and inefficient cost structure were the main culprits behind this performance.
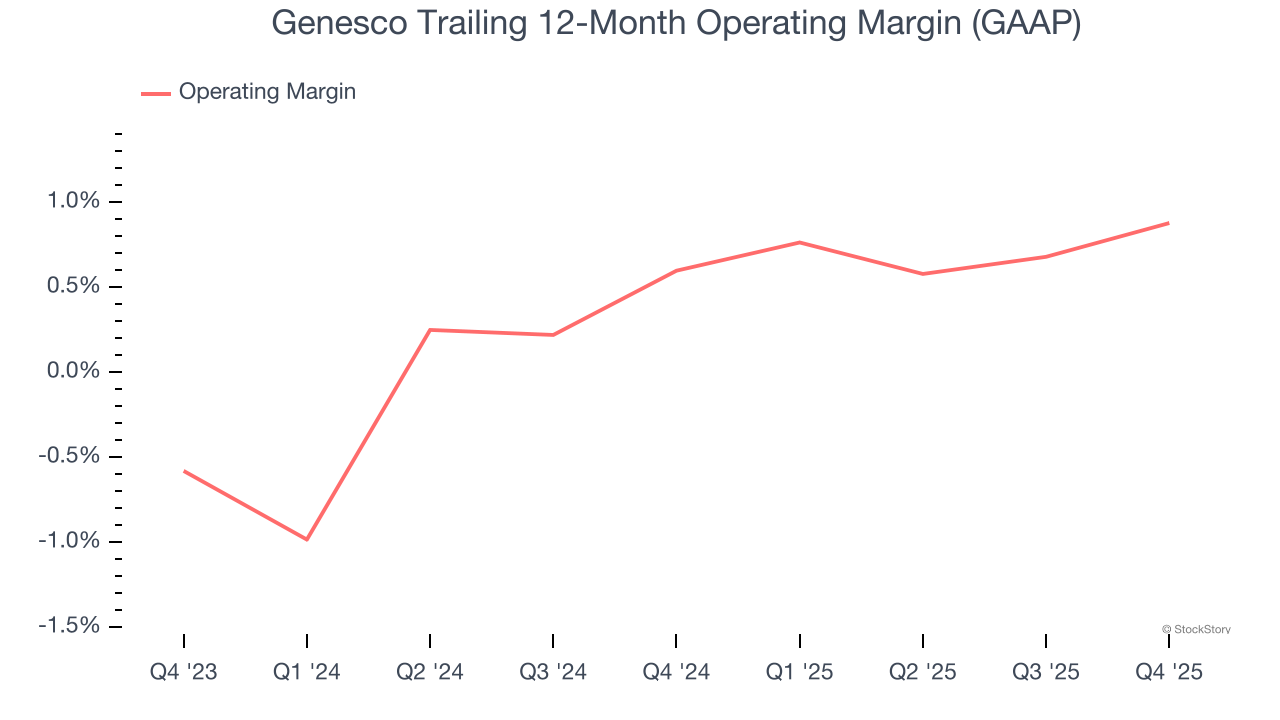
In Q4, Genesco generated an operating margin profit margin of 6.4%, in line with the same quarter last year. This indicates the company’s overall cost structure has been relatively stable.
Earnings Per Share
We track the long-term change in earnings per share (EPS) for the same reason as long-term revenue growth. Compared to revenue, however, EPS highlights whether a company’s growth is profitable.
Genesco’s full-year EPS flipped from negative to positive over the last five years. This is encouraging and shows it’s at a critical moment in its life.
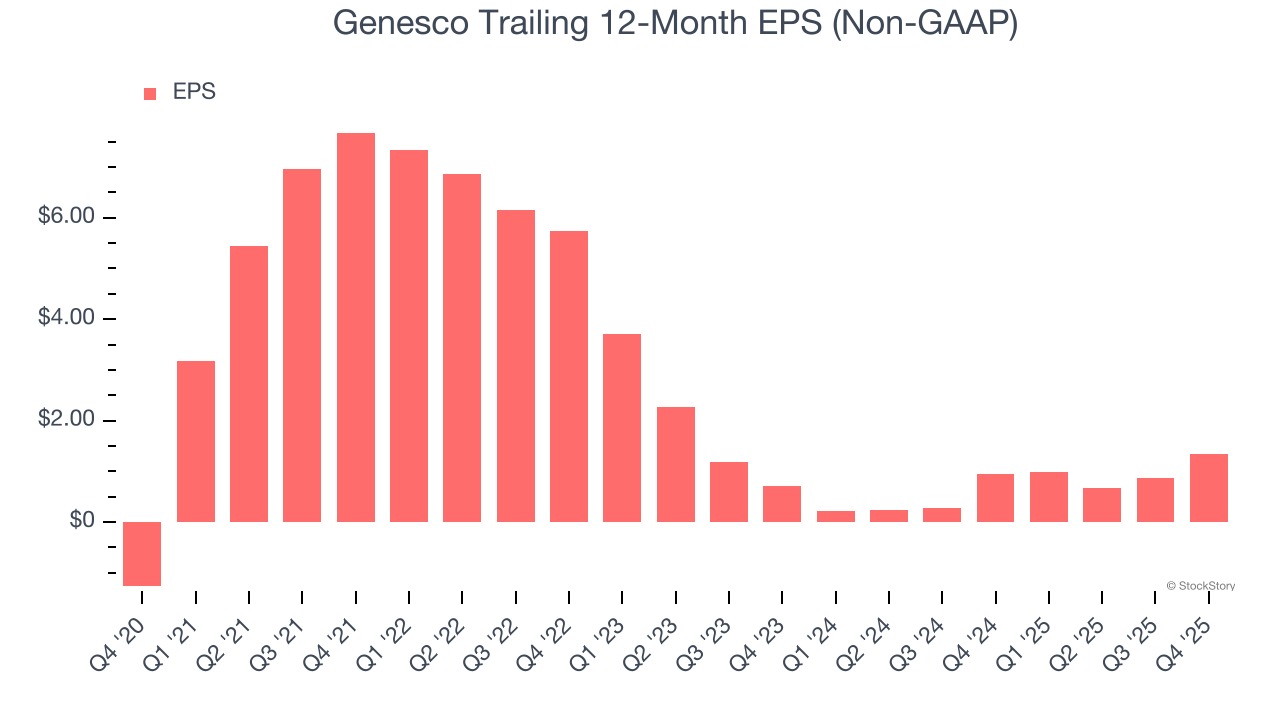
In Q4, Genesco reported adjusted EPS of $3.74, up from $3.26 in the same quarter last year. This print beat analysts’ estimates by 4.3%. Over the next 12 months, Wall Street expects Genesco’s full-year EPS of $1.34 to grow 45.8%.
Key Takeaways from Genesco’s Q4 Results
It was great to see Genesco’s full-year EPS guidance top analysts’ expectations. We were also glad its revenue and EPS both outperformed Wall Street’s estimates in the quarter. Zooming out, we think this was a very good print with some key areas of upside. The stock traded up 7.5% to $28.05 immediately following the results.
Indeed, Genesco had a rock-solid quarterly earnings result, but is this stock a good investment here? We think that the latest quarter is only one piece of the longer-term business quality puzzle. Quality, when combined with valuation, can help determine if the stock is a buy. We cover that in our actionable full research report which you can read here (it’s free).