Gas handling company Chart (NYSE: GTLS) fell short of the market’s revenue expectations in Q4 CY2025, with sales falling 2.5% year on year to $1.08 billion. Its non-GAAP profit of $2.51 per share was 16.7% below analysts’ consensus estimates.
Is now the time to buy Chart? Find out by accessing our full research report, it’s free.
Chart (GTLS) Q4 CY2025 Highlights:
- Revenue: $1.08 billion vs analyst estimates of $1.19 billion (2.5% year-on-year decline, 8.9% miss)
- Adjusted EPS: $2.51 vs analyst expectations of $3.01 (16.7% miss)
- Adjusted EBITDA: $238.8 million vs analyst estimates of $305 million (22.1% margin, 21.7% miss)
- Operating Margin: 9.9%, down from 17% in the same quarter last year
- Free Cash Flow Margin: 6.1%, down from 23.6% in the same quarter last year
- Backlog: $5.89 billion at quarter end, up 21.5% year on year
- Market Capitalization: $9.91 billion
Company Overview
Installing the first bulk Co2 tank for McDonalds’s sodas, Chart (NYSE: GTLS) provides equipment to store and transport gasses.
Revenue Growth
A company’s long-term sales performance can indicate its overall quality. Any business can put up a good quarter or two, but the best consistently grow over the long haul. Luckily, Chart’s sales grew at an incredible 29.4% compounded annual growth rate over the last five years. Its growth surpassed the average industrials company and shows its offerings resonate with customers, a great starting point for our analysis.
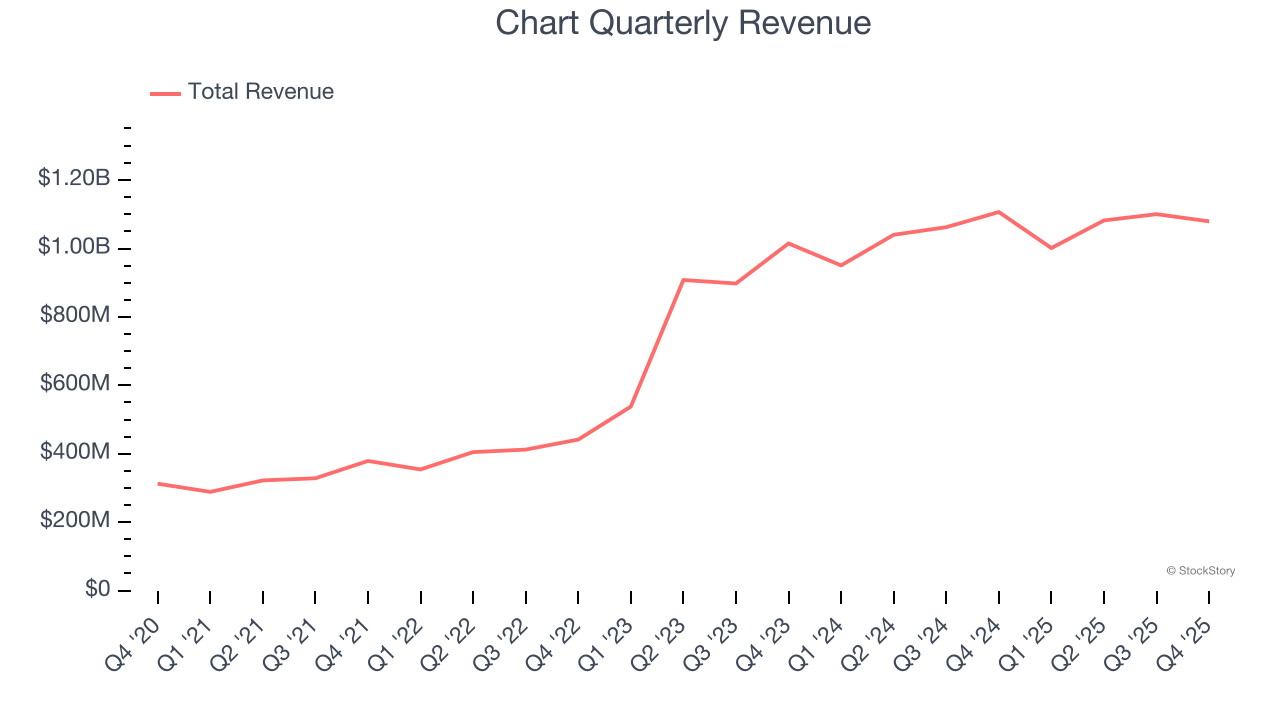
Long-term growth is the most important, but within industrials, a half-decade historical view may miss new industry trends or demand cycles. Chart’s annualized revenue growth of 12.7% over the last two years is below its five-year trend, but we still think the results suggest healthy demand. 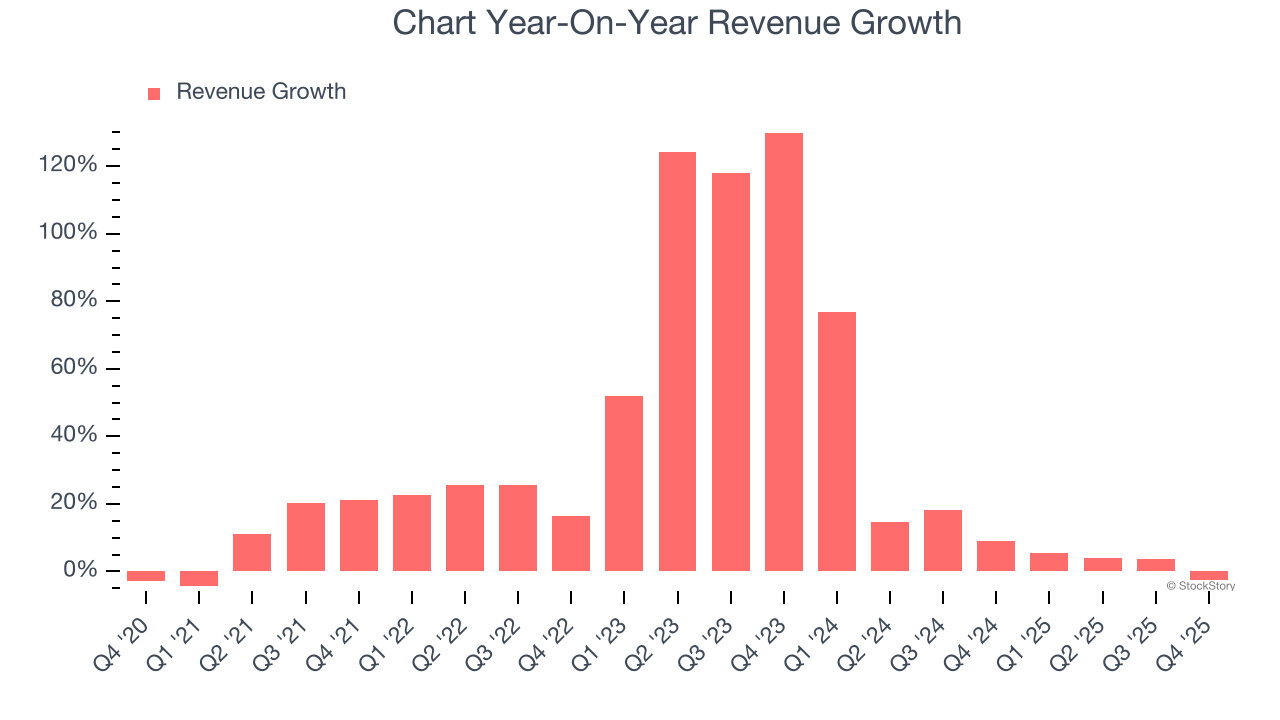
We can better understand the company’s revenue dynamics by analyzing its backlog, or the value of its outstanding orders that have not yet been executed or delivered. Chart’s backlog reached $5.89 billion in the latest quarter and averaged 22.5% year-on-year growth over the last two years. Because this number is better than its revenue growth, we can see the company accumulated more orders than it could fulfill and deferred revenue to the future. This could imply elevated demand for Chart’s products and services but raises concerns about capacity constraints. 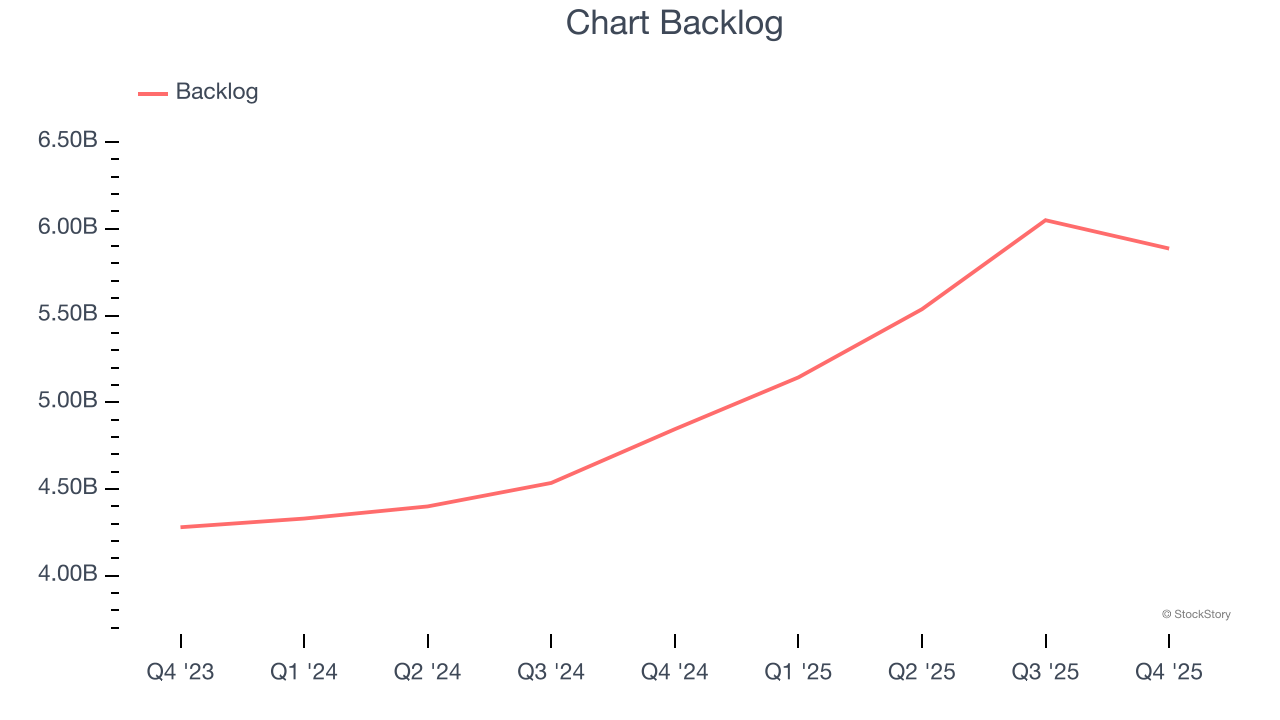
This quarter, Chart missed Wall Street’s estimates and reported a rather uninspiring 2.5% year-on-year revenue decline, generating $1.08 billion of revenue.
Looking ahead, sell-side analysts expect revenue to grow 10.7% over the next 12 months, a slight deceleration versus the last two years. Despite the slowdown, this projection is noteworthy and implies the market sees success for its products and services.
Microsoft, Alphabet, Coca-Cola, Monster Beverage—all began as under-the-radar growth stories riding a massive trend. We’ve identified the next one: a profitable AI semiconductor play Wall Street is still overlooking. Go here for access to our full report.
Operating Margin
Chart has managed its cost base well over the last five years. It demonstrated solid profitability for an industrials business, producing an average operating margin of 11%.
Looking at the trend in its profitability, Chart’s operating margin rose by 1.3 percentage points over the last five years, as its sales growth gave it operating leverage.
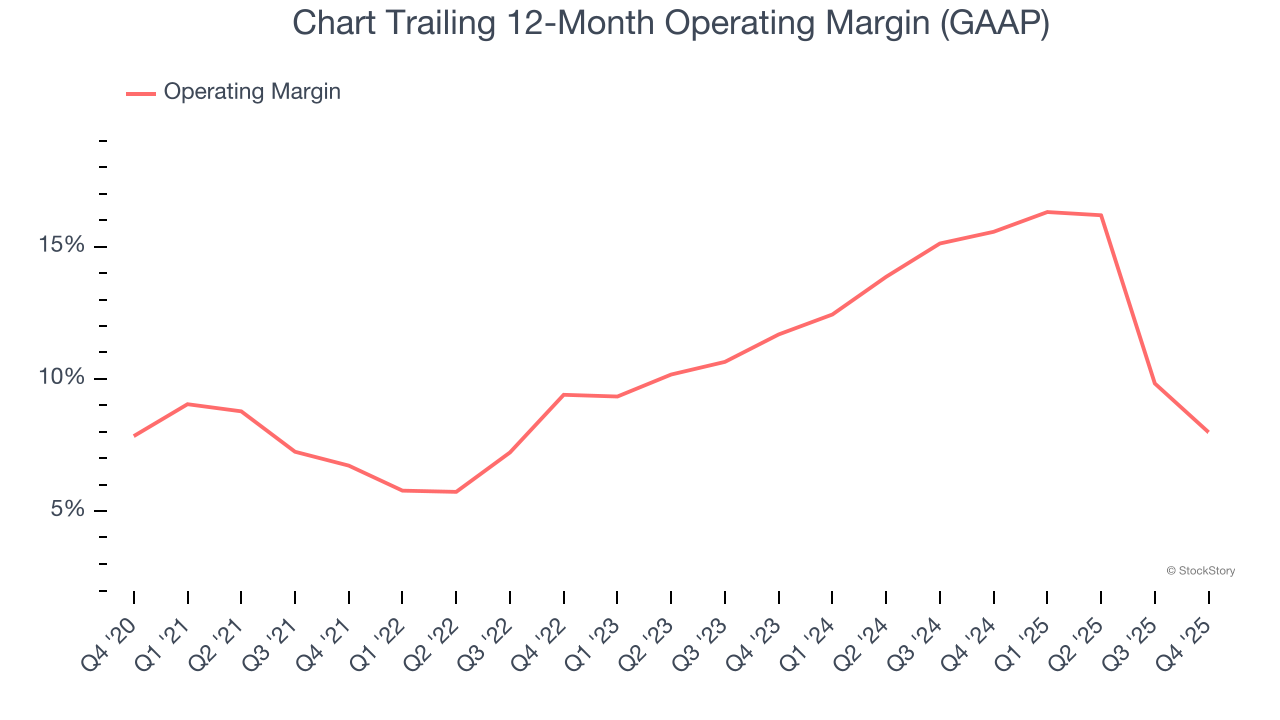
In Q4, Chart generated an operating margin profit margin of 9.9%, down 7.1 percentage points year on year. Since Chart’s operating margin decreased more than its gross margin, we can assume it was less efficient because expenses such as marketing, R&D, and administrative overhead increased.
Earnings Per Share
We track the long-term change in earnings per share (EPS) for the same reason as long-term revenue growth. Compared to revenue, however, EPS highlights whether a company’s growth is profitable.
Chart’s EPS grew at an astounding 24.4% compounded annual growth rate over the last five years. Despite its operating margin improvement during that time, this performance was lower than its 29.4% annualized revenue growth, telling us that non-fundamental factors such as interest and taxes affected its ultimate earnings.
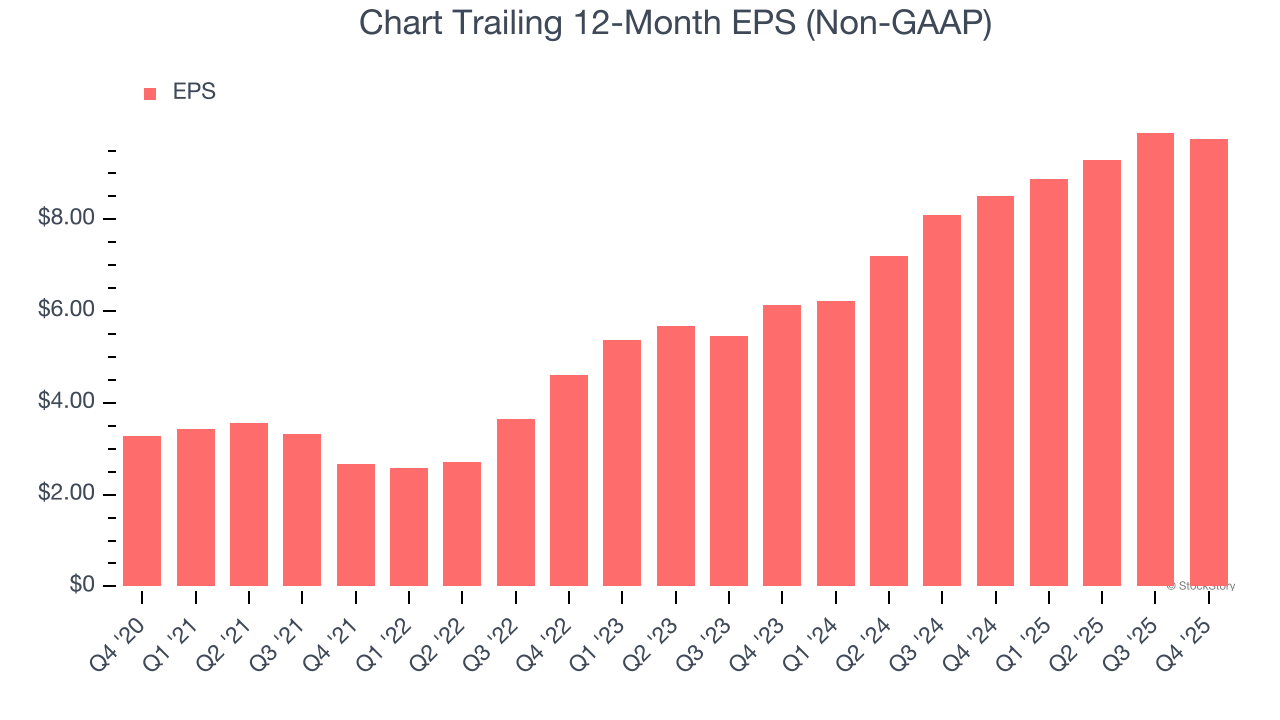
We can take a deeper look into Chart’s earnings to better understand the drivers of its performance. A five-year view shows Chart has diluted its shareholders, growing its share count by 19%. This dilution overshadowed its increased operational efficiency and has led to lower per share earnings. Taxes and interest expenses can also affect EPS but don’t tell us as much about a company’s fundamentals. 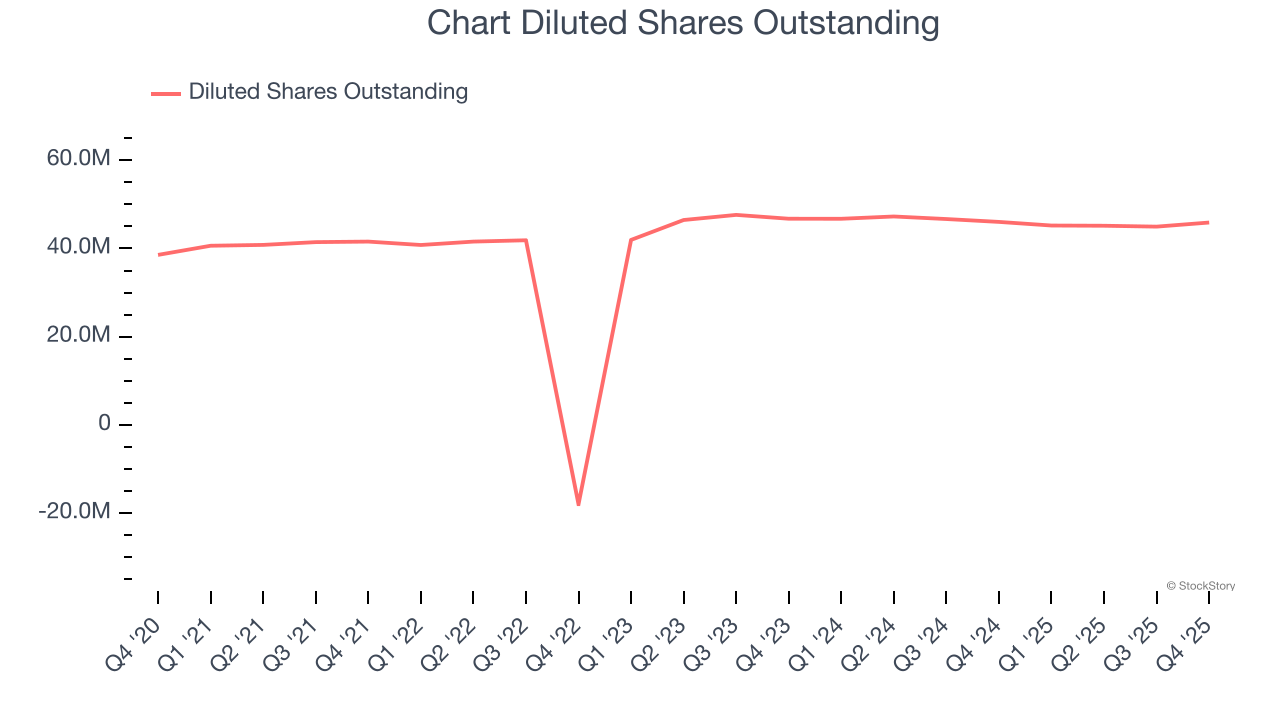
Like with revenue, we analyze EPS over a shorter period to see if we are missing a change in the business.
For Chart, its two-year annual EPS growth of 26.1% was higher than its five-year trend. We love it when earnings growth accelerates, especially when it accelerates off an already high base.
In Q4, Chart reported adjusted EPS of $2.51, down from $2.66 in the same quarter last year. This print missed analysts’ estimates, but we care more about long-term adjusted EPS growth than short-term movements. Over the next 12 months, Wall Street expects Chart’s full-year EPS of $9.74 to grow 33.3%.
Key Takeaways from Chart’s Q4 Results
We struggled to find many positives in these results. Its revenue missed and its EBITDA fell short of Wall Street’s estimates. Overall, this was a softer quarter. The stock remained flat at $207.29 immediately following the results.
Chart underperformed this quarter, but does that create an opportunity to invest right now? We think that the latest quarter is only one piece of the longer-term business quality puzzle. Quality, when combined with valuation, can help determine if the stock is a buy. We cover that in our actionable full research report which you can read here (it’s free).