Industrial process heating solutions provider Thermon (NYSE: THR) reported revenue ahead of Wall Street’s expectations in Q4 CY2025, with sales up 9.6% year on year to $147.3 million. The company’s full-year revenue guidance of $521 million at the midpoint came in 0.8% above analysts’ estimates. Its non-GAAP profit of $0.66 per share was 13.4% above analysts’ consensus estimates.
Is now the time to buy Thermon? Find out by accessing our full research report, it’s free.
Thermon (THR) Q4 CY2025 Highlights:
- Revenue: $147.3 million vs analyst estimates of $138.3 million (9.6% year-on-year growth, 6.5% beat)
- Adjusted EPS: $0.66 vs analyst estimates of $0.58 (13.4% beat)
- Adjusted EBITDA: $35.6 million vs analyst estimates of $32.07 million (24.2% margin, 11% beat)
- The company slightly lifted its revenue guidance for the full year to $521 million at the midpoint from $516.5 million
- Management raised its full-year Adjusted EPS guidance to $2.12 at the midpoint, a 2.2% increase
- EBITDA guidance for the full year is $117 million at the midpoint, above analyst estimates of $115.7 million
- Operating Margin: 18.1%, in line with the same quarter last year
- Free Cash Flow Margin: 8.9%, up from 6.3% in the same quarter last year
- Market Capitalization: $1.52 billion
Company Overview
Creating the first packaged tracing systems, Thermon (NYSE: THR) is a leading provider of engineered industrial process heating solutions for process industries.
Revenue Growth
A company’s long-term sales performance can indicate its overall quality. Any business can put up a good quarter or two, but many enduring ones grow for years. Luckily, Thermon’s sales grew at an excellent 12.4% compounded annual growth rate over the last five years. Its growth beat the average industrials company and shows its offerings resonate with customers.
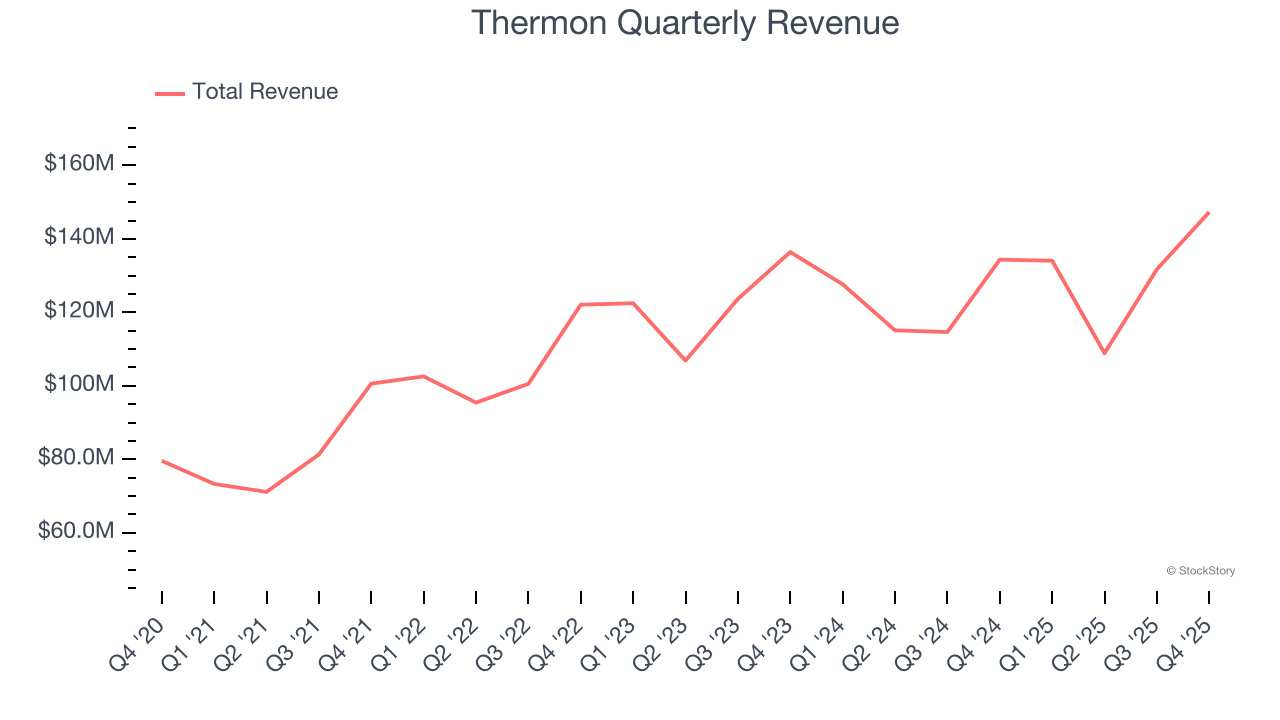
We at StockStory place the most emphasis on long-term growth, but within industrials, a half-decade historical view may miss cycles, industry trends, or a company capitalizing on catalysts such as a new contract win or a successful product line. Thermon’s recent performance shows its demand has slowed significantly as its annualized revenue growth of 3.3% over the last two years was well below its five-year trend. 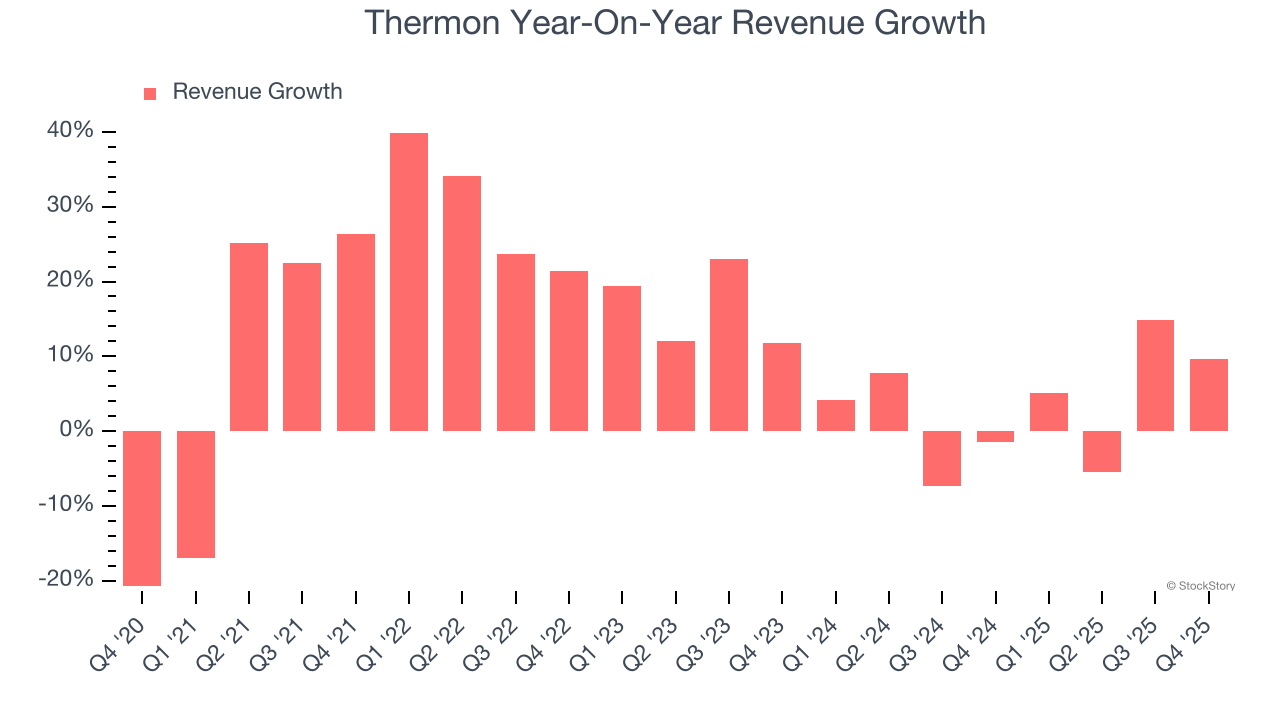
This quarter, Thermon reported year-on-year revenue growth of 9.6%, and its $147.3 million of revenue exceeded Wall Street’s estimates by 6.5%.
Looking ahead, sell-side analysts expect revenue to grow 3.5% over the next 12 months, similar to its two-year rate. This projection is underwhelming and suggests its newer products and services will not lead to better top-line performance yet.
While Wall Street chases Nvidia at all-time highs, an under-the-radar semiconductor supplier is dominating a critical AI component these giants can’t build without. Click here to access our free report one of our favorites growth stories.
Operating Margin
Thermon has been an efficient company over the last five years. It was one of the more profitable businesses in the industrials sector, boasting an average operating margin of 14.6%. This result isn’t surprising as its high gross margin gives it a favorable starting point.
Analyzing the trend in its profitability, Thermon’s operating margin rose by 8.8 percentage points over the last five years, as its sales growth gave it immense operating leverage.
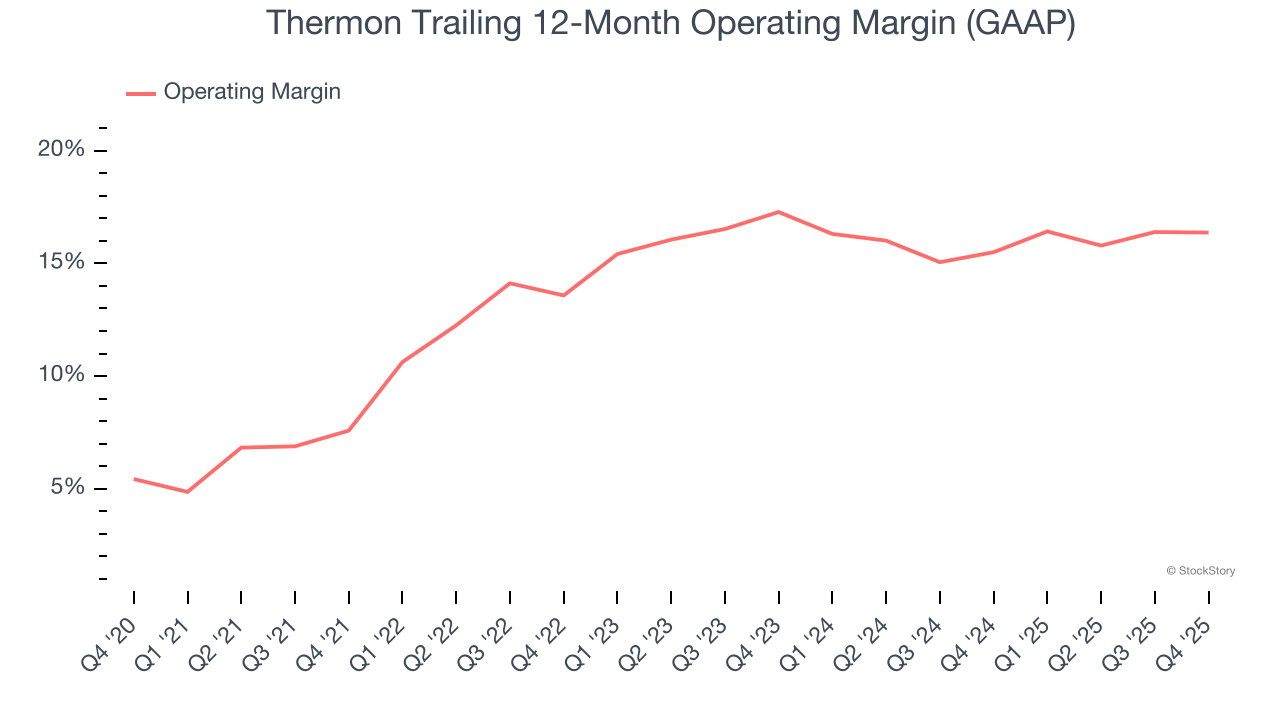
In Q4, Thermon generated an operating margin profit margin of 18.1%, in line with the same quarter last year. This indicates the company’s cost structure has recently been stable.
Earnings Per Share
Revenue trends explain a company’s historical growth, but the long-term change in earnings per share (EPS) points to the profitability of that growth – for example, a company could inflate its sales through excessive spending on advertising and promotions.
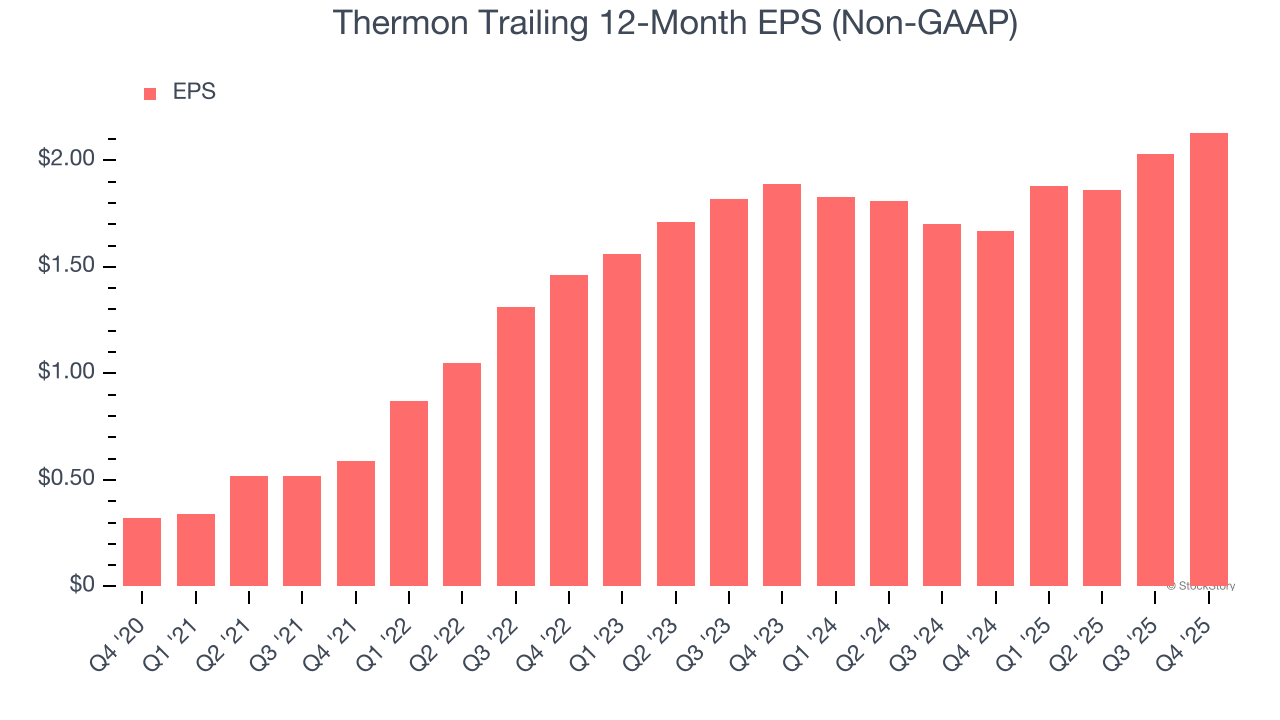
Thermon’s EPS grew at an astounding 46.1% compounded annual growth rate over the last five years, higher than its 12.4% annualized revenue growth. This tells us the company became more profitable on a per-share basis as it expanded.
Diving into the nuances of Thermon’s earnings can give us a better understanding of its performance. As we mentioned earlier, Thermon’s operating margin was flat this quarter but expanded by 8.8 percentage points over the last five years. This was the most relevant factor (aside from the revenue impact) behind its higher earnings; interest expenses and taxes can also affect EPS but don’t tell us as much about a company’s fundamentals.
Like with revenue, we analyze EPS over a shorter period to see if we are missing a change in the business.
For Thermon, its two-year annual EPS growth of 6.2% was lower than its five-year trend. We hope its growth can accelerate in the future.
In Q4, Thermon reported adjusted EPS of $0.66, up from $0.56 in the same quarter last year. This print easily cleared analysts’ estimates, and shareholders should be content with the results. Over the next 12 months, Wall Street expects Thermon’s full-year EPS of $2.13 to stay about the same.
Key Takeaways from Thermon’s Q4 Results
We were impressed by how significantly Thermon blew past analysts’ EBITDA expectations this quarter. We were also excited its revenue outperformed Wall Street’s estimates by a wide margin. Zooming out, we think this quarter featured some important positives. The stock traded up 6% to $48.95 immediately following the results.
Indeed, Thermon had a rock-solid quarterly earnings result, but is this stock a good investment here? If you’re making that decision, you should consider the bigger picture of valuation, business qualities, as well as the latest earnings. We cover that in our actionable full research report which you can read here (it’s free).