
Clinical research company IQVIA (NYSE: IQV) reported Q4 CY2025 results exceeding the market’s revenue expectations, with sales up 10.3% year on year to $4.36 billion. The company’s full-year revenue guidance of $17.25 billion at the midpoint came in 1% above analysts’ estimates. Its non-GAAP profit of $3.42 per share was 0.7% above analysts’ consensus estimates.
Is now the time to buy IQVIA? Find out by accessing our full research report, it’s free.
IQVIA (IQV) Q4 CY2025 Highlights:
- Revenue: $4.36 billion vs analyst estimates of $4.24 billion (10.3% year-on-year growth, 2.9% beat)
- Adjusted EPS: $3.42 vs analyst estimates of $3.40 (0.7% beat)
- Adjusted EBITDA: $1.05 billion vs analyst estimates of $1.04 billion (24% margin, in line)
- Adjusted EPS guidance for the upcoming financial year 2026 is $12.70 at the midpoint, missing analyst estimates by 2%
- EBITDA guidance for the upcoming financial year 2026 is $4 billion at the midpoint, in line with analyst expectations
- Operating Margin: 14.4%, down from 15.8% in the same quarter last year
- Free Cash Flow Margin: 12.9%, down from 18.2% in the same quarter last year
- Constant Currency Revenue rose 8.1% year on year (3% in the same quarter last year)
- Market Capitalization: $34.49 billion
"IQVIA closed 2025 with strong performance across all segments," said Ari Bousbib, chairman and CEO of IQVIA.
Company Overview
Created from the 2016 merger of Quintiles (a clinical research organization) and IMS Health (a healthcare data specialist), IQVIA (NYSE: IQV) provides clinical research services, data analytics, and technology solutions to help pharmaceutical companies develop and market medications more effectively.
Revenue Growth
Examining a company’s long-term performance can provide clues about its quality. Even a bad business can shine for one or two quarters, but a top-tier one grows for years. Thankfully, IQVIA’s 7.5% annualized revenue growth over the last five years was decent. Its growth was slightly above the average healthcare company and shows its offerings resonate with customers.
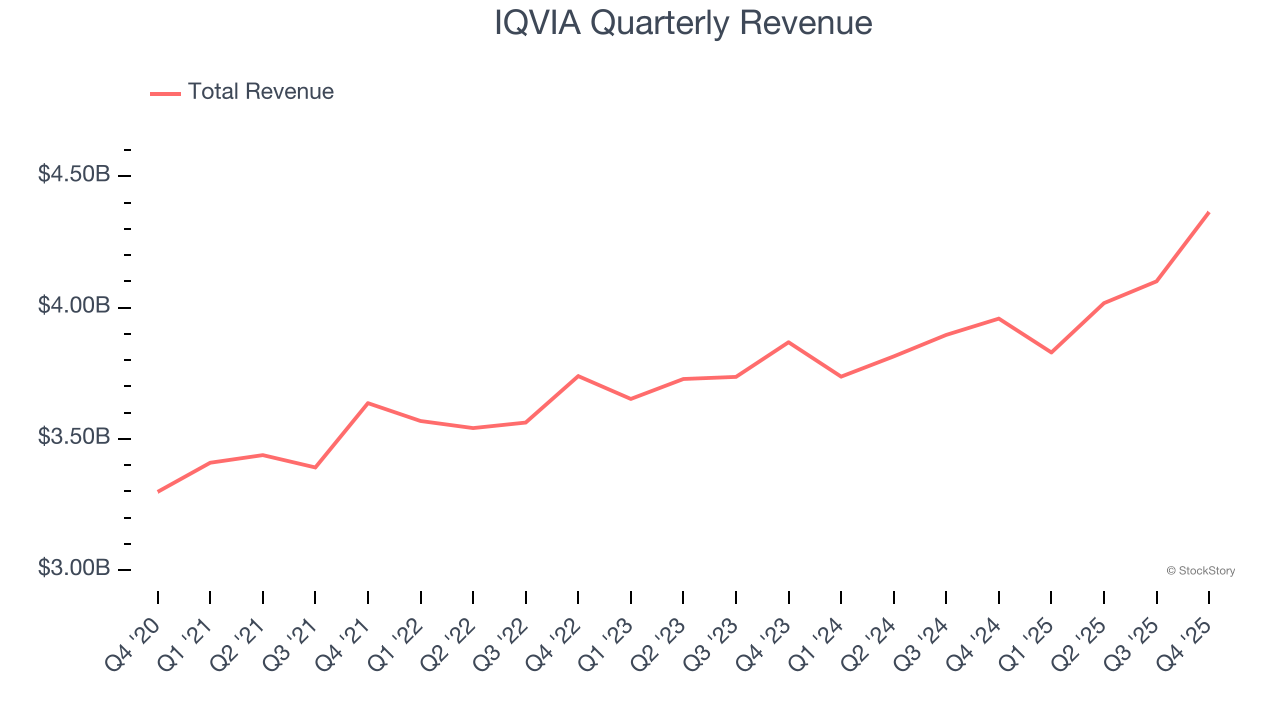
We at StockStory place the most emphasis on long-term growth, but within healthcare, a half-decade historical view may miss recent innovations or disruptive industry trends. IQVIA’s recent performance shows its demand has slowed as its annualized revenue growth of 4.3% over the last two years was below its five-year trend. 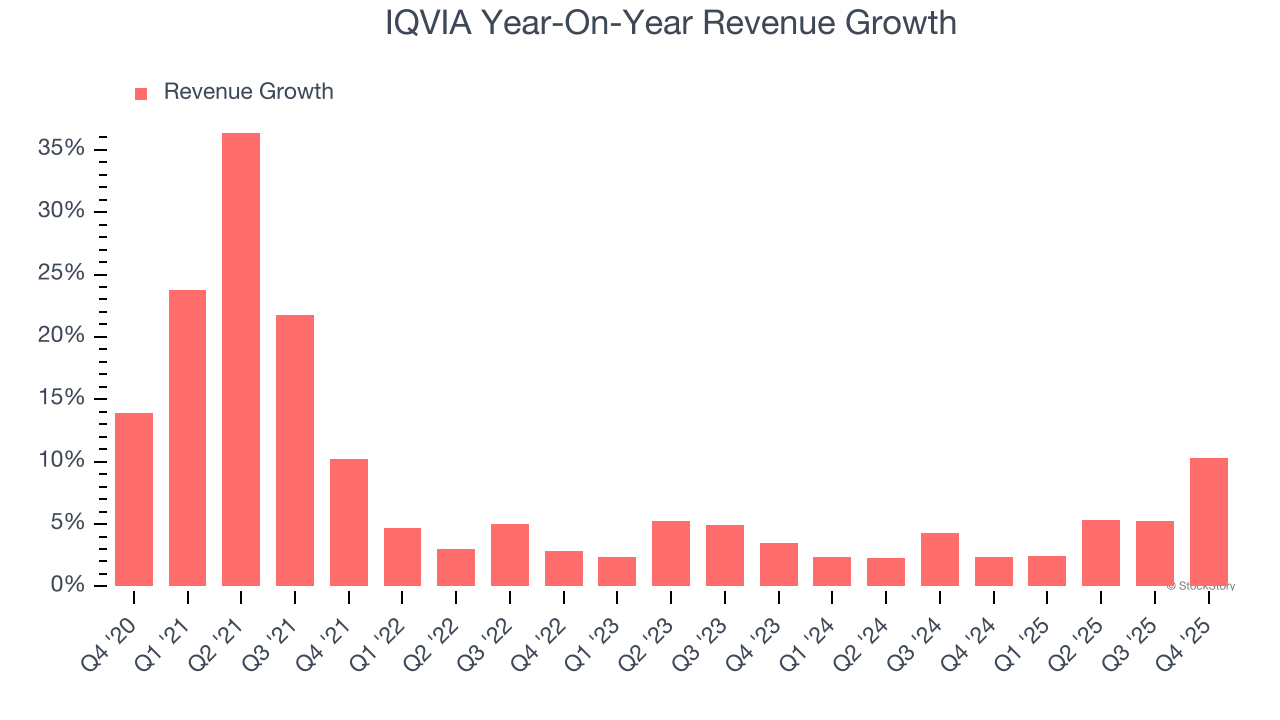
IQVIA also reports sales performance excluding currency movements, which are outside the company’s control and not indicative of demand. Over the last two years, its constant currency sales averaged 4.1% year-on-year growth. Because this number aligns with its normal revenue growth, we can see that IQVIA has properly hedged its foreign currency exposure. 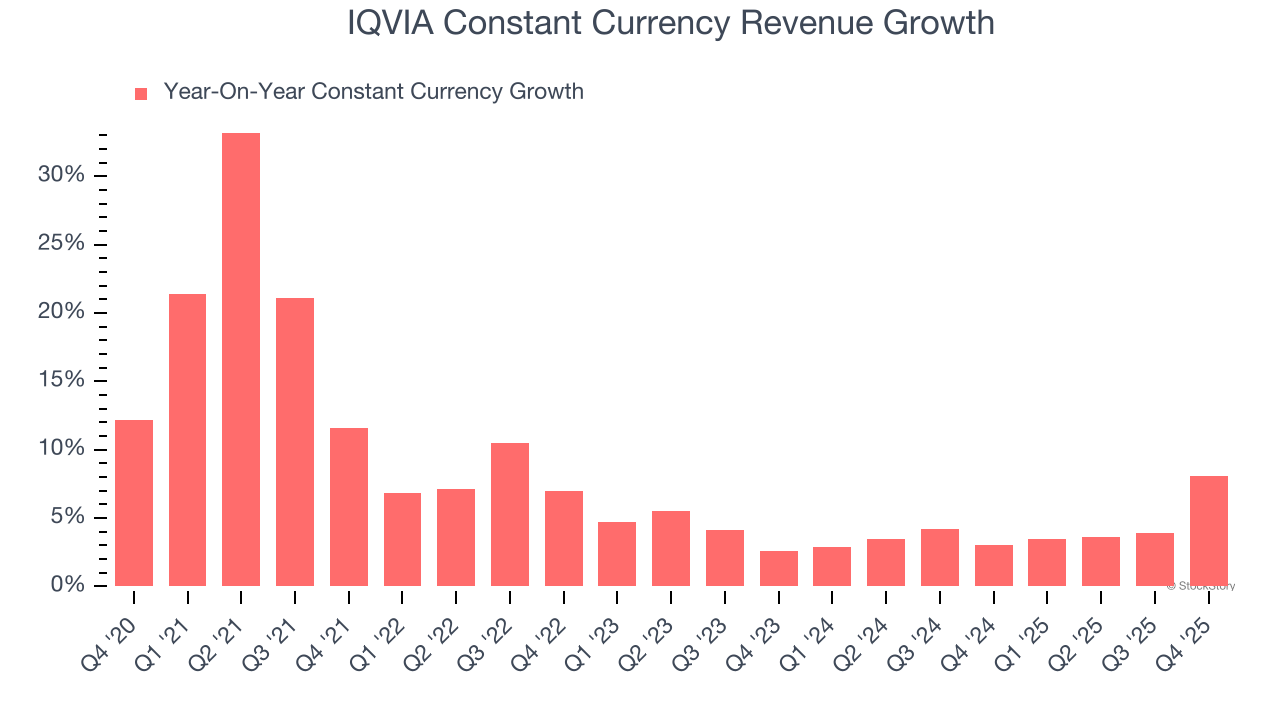
This quarter, IQVIA reported year-on-year revenue growth of 10.3%, and its $4.36 billion of revenue exceeded Wall Street’s estimates by 2.9%.
Looking ahead, sell-side analysts expect revenue to grow 4.7% over the next 12 months, similar to its two-year rate. This projection is underwhelming and indicates its newer products and services will not catalyze better top-line performance yet.
While Wall Street chases Nvidia at all-time highs, an under-the-radar semiconductor supplier is dominating a critical AI component these giants can’t build without. Click here to access our free report one of our favorites growth stories.
Operating Margin
IQVIA has done a decent job managing its cost base over the last five years. The company has produced an average operating margin of 12.7%, higher than the broader healthcare sector.
Analyzing the trend in its profitability, IQVIA’s operating margin rose by 3.3 percentage points over the last five years, as its sales growth gave it operating leverage.
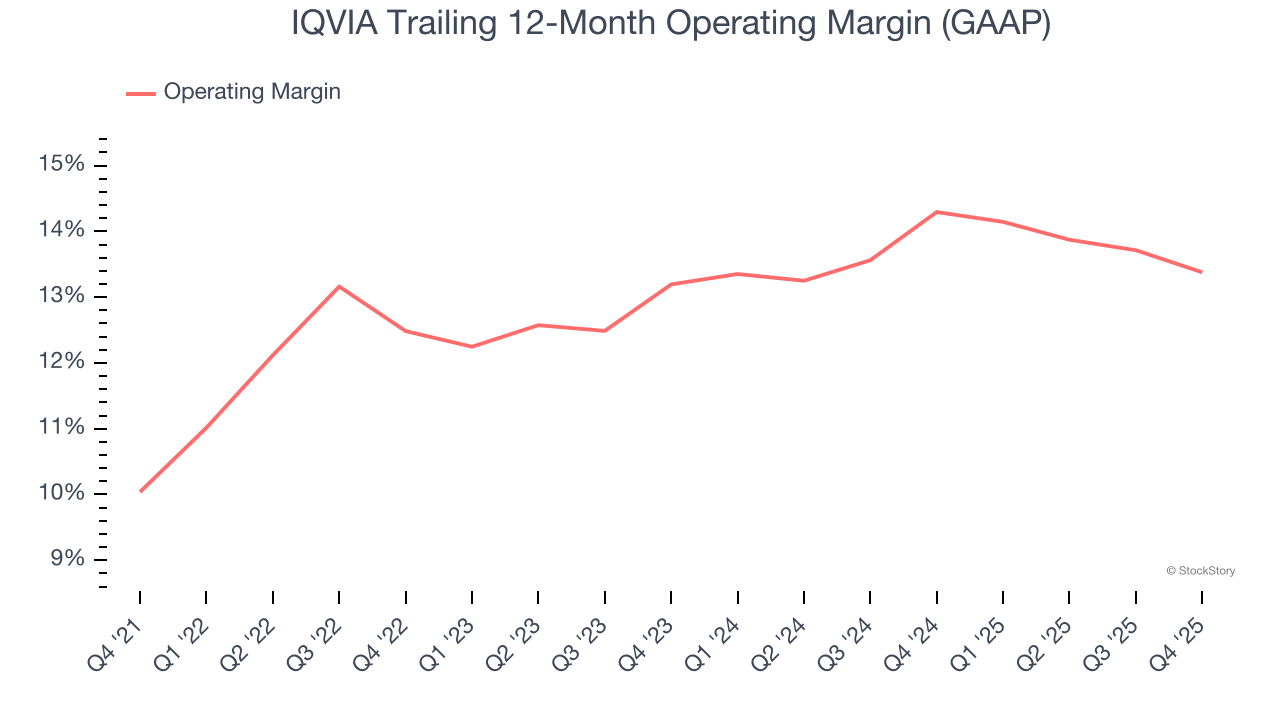
In Q4, IQVIA generated an operating margin profit margin of 14.4%, down 1.4 percentage points year on year. This reduction is quite minuscule and indicates the company’s overall cost structure has been relatively stable.
Earnings Per Share
Revenue trends explain a company’s historical growth, but the long-term change in earnings per share (EPS) points to the profitability of that growth – for example, a company could inflate its sales through excessive spending on advertising and promotions.
IQVIA’s EPS grew at a spectacular 13.1% compounded annual growth rate over the last five years, higher than its 7.5% annualized revenue growth. This tells us the company became more profitable on a per-share basis as it expanded.
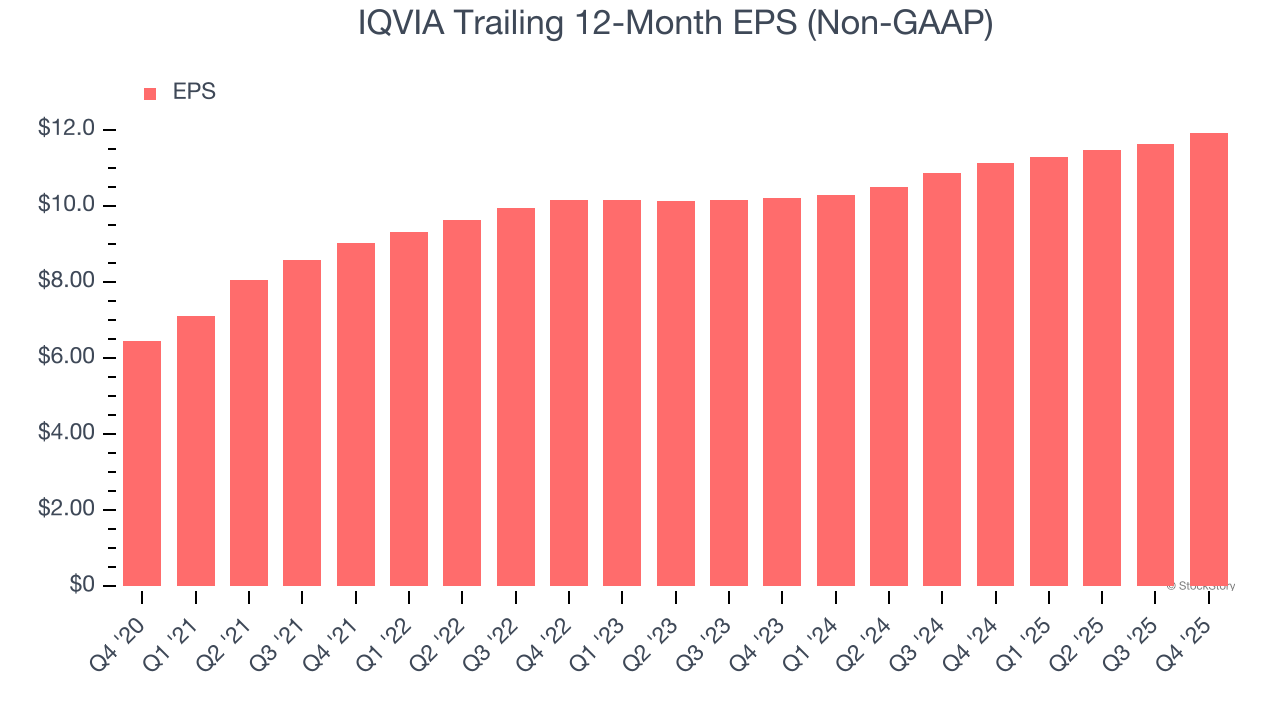
We can take a deeper look into IQVIA’s earnings quality to better understand the drivers of its performance. As we mentioned earlier, IQVIA’s operating margin declined this quarter but expanded by 3.3 percentage points over the last five years. Its share count also shrank by 12%, and these factors together are positive signs for shareholders because improving profitability and share buybacks turbocharge EPS growth relative to revenue growth. 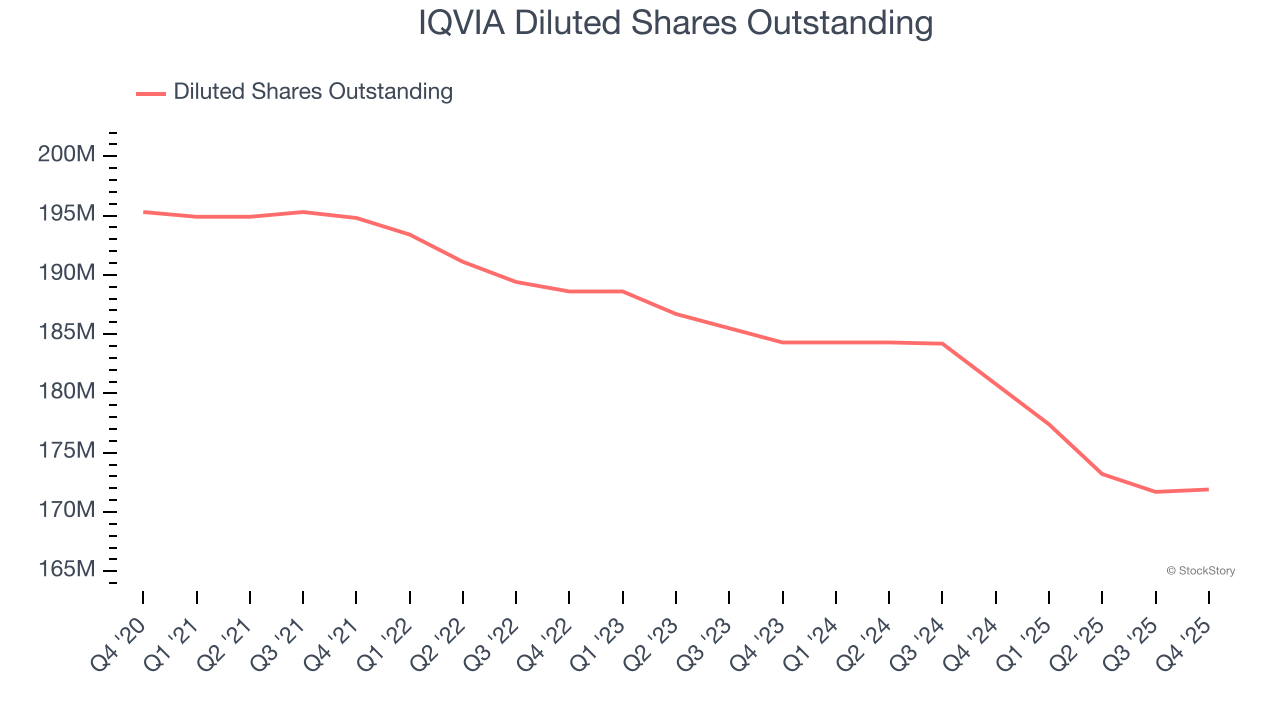
In Q4, IQVIA reported adjusted EPS of $3.42, up from $3.12 in the same quarter last year. This print was close to analysts’ estimates. Over the next 12 months, Wall Street expects IQVIA’s full-year EPS of $11.93 to grow 7.9%.
Key Takeaways from IQVIA’s Q4 Results
We enjoyed seeing IQVIA beat analysts’ constant currency revenue expectations this quarter. We were also glad its revenue outperformed Wall Street’s estimates. On the other hand, its full-year EPS guidance missed. Overall, this print had some key positives. The stock remained flat at $201.50 immediately following the results.
Should you buy the stock or not? The latest quarter does matter, but not nearly as much as longer-term fundamentals and valuation, when deciding if the stock is a buy. We cover that in our actionable full research report which you can read here (it’s free).