Multi-industry consumer and professional products manufacturer Griffon Corporation (NYSE: GFF) beat Wall Street’s revenue expectations in Q4 CY2025, with sales up 2.6% year on year to $649.1 million. On the other hand, the company’s full-year revenue guidance of $1.8 billion at the midpoint came in 28.9% below analysts’ estimates. Its non-GAAP profit of $1.45 per share was 8.9% above analysts’ consensus estimates.
Is now the time to buy Griffon? Find out by accessing our full research report, it’s free.
Griffon (GFF) Q4 CY2025 Highlights:
- Revenue: $649.1 million vs analyst estimates of $619.4 million (2.6% year-on-year growth, 4.8% beat)
- Adjusted EPS: $1.45 vs analyst estimates of $1.33 (8.9% beat)
- Adjusted EBITDA: $129.6 million vs analyst estimates of $123.5 million (20% margin, 4.9% beat)
- The company dropped its revenue guidance for the full year to $1.8 billion at the midpoint from $2.5 billion, a 28% decrease
- EBITDA guidance for the full year is $520 million at the midpoint, below analyst estimates of $534 million
- Operating Margin: 17.5%, in line with the same quarter last year
- Free Cash Flow Margin: 15.3%, down from 22.6% in the same quarter last year
- Market Capitalization: $3.95 billion
“We are pleased with our first quarter performance, highlighted by free cash flow of $99 million, continued solid operating performance at Home and Building Products, and improved profitability at Consumer and Professional Products,” said Ronald J. Kramer, Chairman and Chief Executive Officer.
Company Overview
Initially in the defense industry, Griffon (NYSE: GFF) is a now diversified company specializing in home improvement, professional equipment, and building products.
Revenue Growth
A company’s long-term sales performance is one signal of its overall quality. Any business can put up a good quarter or two, but the best consistently grow over the long haul. Unfortunately, Griffon’s 1.5% annualized revenue growth over the last five years was sluggish. This was below our standards and is a rough starting point for our analysis.
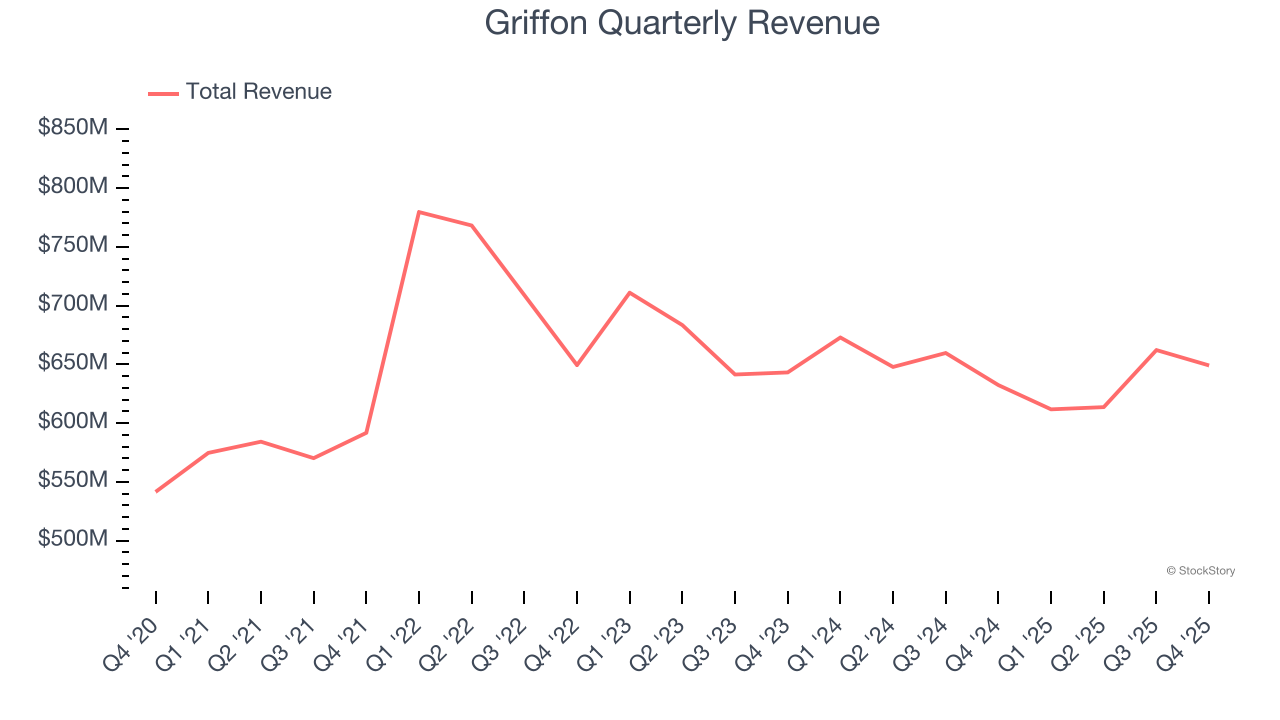
Long-term growth is the most important, but within industrials, a half-decade historical view may miss new industry trends or demand cycles. Griffon’s performance shows it grew in the past but relinquished its gains over the last two years, as its revenue fell by 2.7% annually. 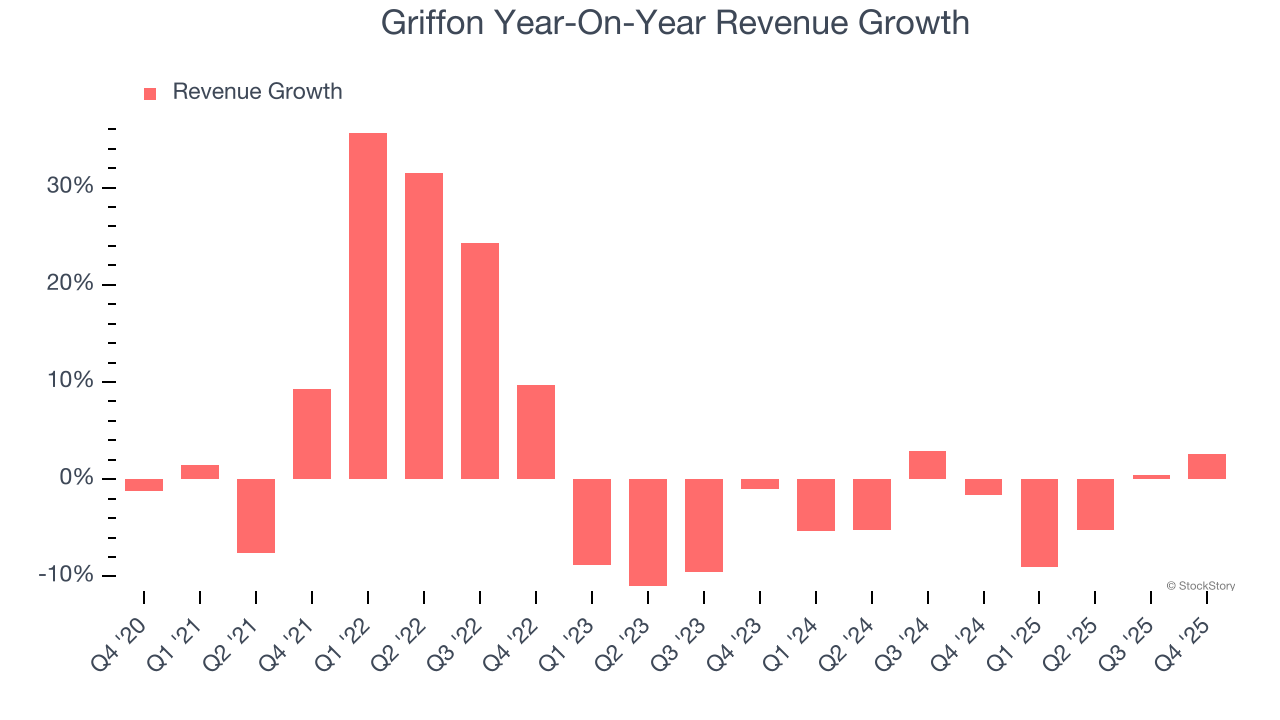
This quarter, Griffon reported modest year-on-year revenue growth of 2.6% but beat Wall Street’s estimates by 4.8%.
Looking ahead, sell-side analysts expect revenue to grow 1.1% over the next 12 months. Although this projection suggests its newer products and services will spur better top-line performance, it is still below average for the sector.
Microsoft, Alphabet, Coca-Cola, Monster Beverage—all began as under-the-radar growth stories riding a massive trend. We’ve identified the next one: a profitable AI semiconductor play Wall Street is still overlooking. Go here for access to our full report.
Operating Margin
Operating margin is an important measure of profitability as it shows the portion of revenue left after accounting for all core expenses – everything from the cost of goods sold to advertising and wages. It’s also useful for comparing profitability across companies with different levels of debt and tax rates because it excludes interest and taxes.
Griffon has been an efficient company over the last five years. It was one of the more profitable businesses in the industrials sector, boasting an average operating margin of 14.8%. This result isn’t surprising as its high gross margin gives it a favorable starting point.
Analyzing the trend in its profitability, Griffon’s operating margin rose by 10.3 percentage points over the last five years, as its sales growth gave it operating leverage.
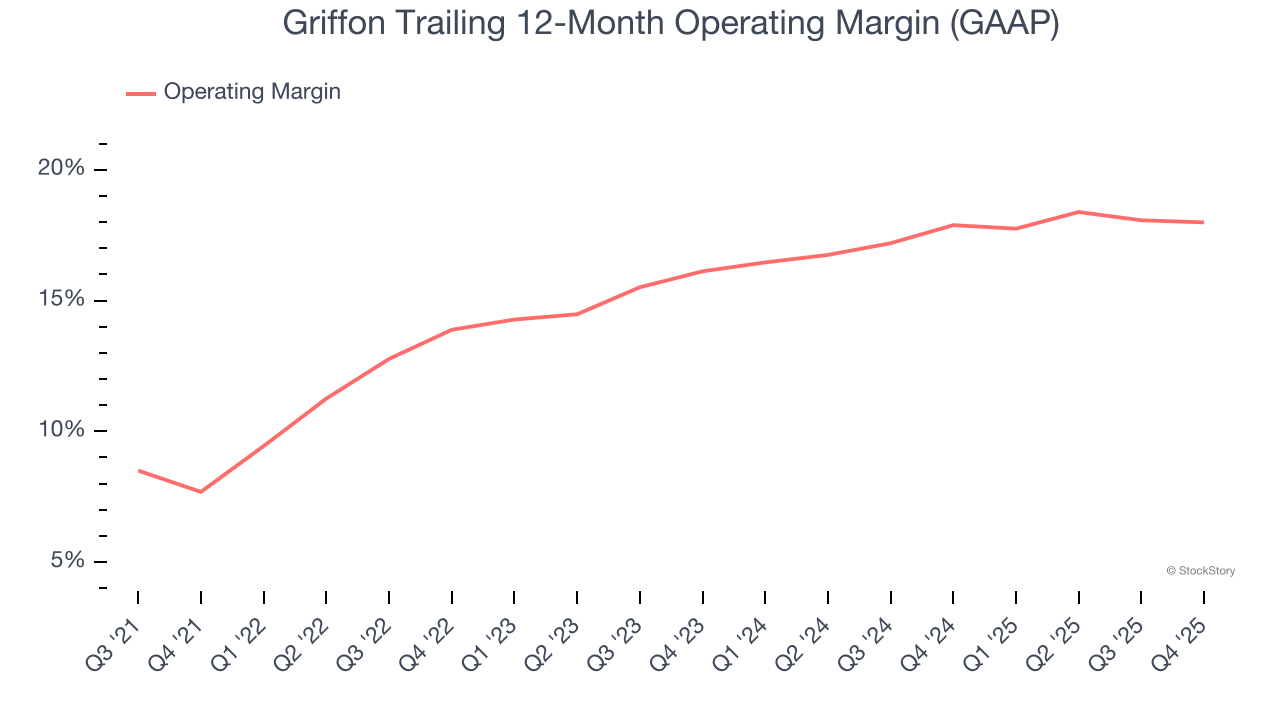
This quarter, Griffon generated an operating margin profit margin of 17.5%, in line with the same quarter last year. This indicates the company’s cost structure has recently been stable.
Earnings Per Share
Revenue trends explain a company’s historical growth, but the long-term change in earnings per share (EPS) points to the profitability of that growth – for example, a company could inflate its sales through excessive spending on advertising and promotions.
Griffon’s EPS grew at an astounding 25.7% compounded annual growth rate over the last five years, higher than its 1.5% annualized revenue growth. This tells us the company became more profitable on a per-share basis as it expanded.
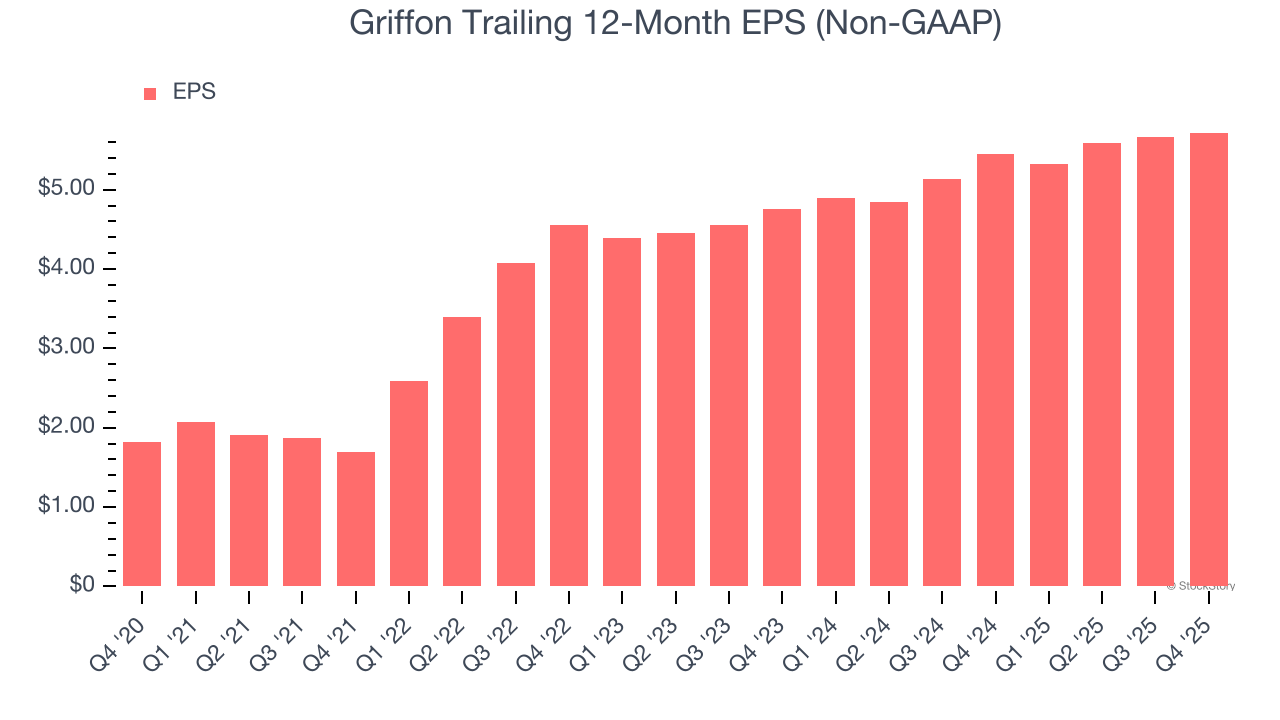
We can take a deeper look into Griffon’s earnings quality to better understand the drivers of its performance. As we mentioned earlier, Griffon’s operating margin was flat this quarter but expanded by 10.3 percentage points over the last five years. On top of that, its share count shrank by 14%. These are positive signs for shareholders because improving profitability and share buybacks turbocharge EPS growth relative to revenue growth. 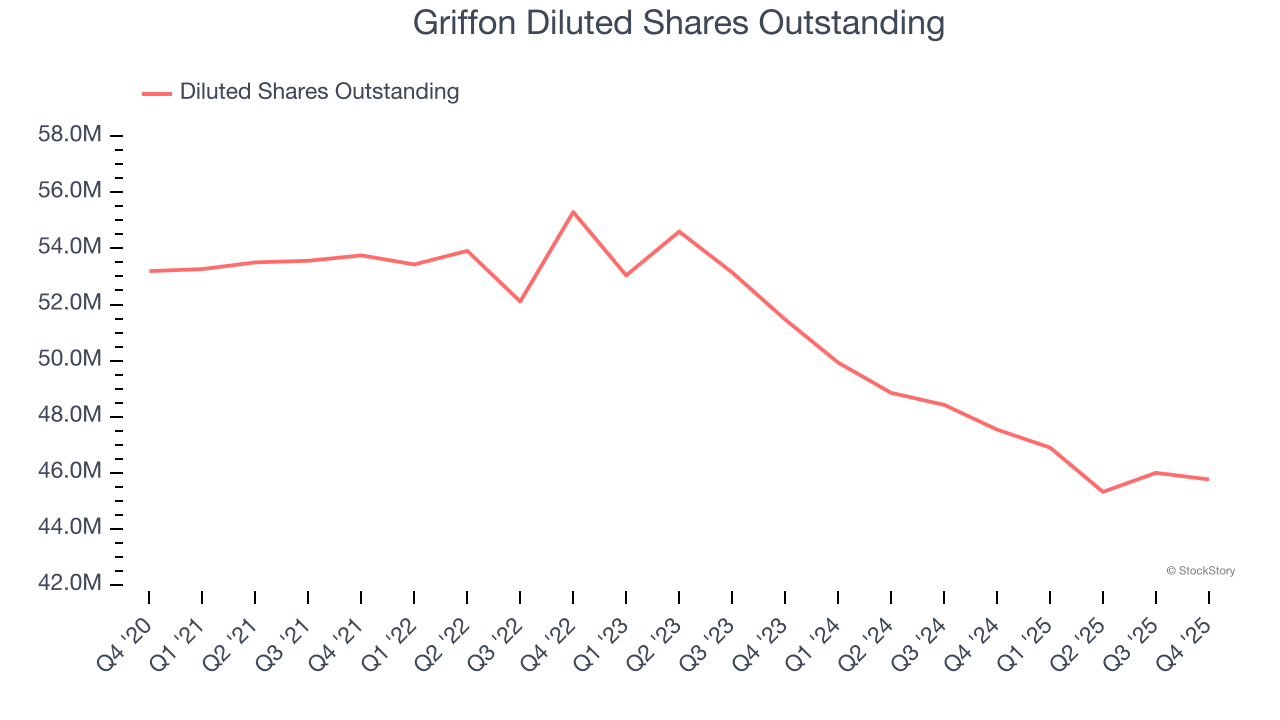
Like with revenue, we analyze EPS over a shorter period to see if we are missing a change in the business.
For Griffon, its two-year annual EPS growth of 9.6% was lower than its five-year trend. We hope its growth can accelerate in the future.
In Q4, Griffon reported adjusted EPS of $1.45, up from $1.39 in the same quarter last year. This print beat analysts’ estimates by 8.9%. Over the next 12 months, Wall Street expects Griffon’s full-year EPS of $5.72 to grow 9.1%.
Key Takeaways from Griffon’s Q4 Results
We were impressed by how significantly Griffon blew past analysts’ revenue expectations this quarter. We were also glad its EBITDA outperformed Wall Street’s estimates. On the other hand, its full-year revenue guidance missed and its full-year EBITDA guidance fell short of Wall Street’s estimates. Overall, this quarter could have been better, as guidance is weighing on shares. The stock traded down 3.2% to $82.03 immediately following the results.
Should you buy the stock or not? The latest quarter does matter, but not nearly as much as longer-term fundamentals and valuation, when deciding if the stock is a buy. We cover that in our actionable full research report which you can read here (it’s free).