

Global airline American Airlines (NASDAQ: AAL) met Wall Streets revenue expectations in Q4 CY2025, with sales up 2.5% year on year to $14 billion. Its non-GAAP profit of $0.16 per share was 54.6% below analysts’ consensus estimates.
Is now the time to buy American Airlines? Find out by accessing our full research report, it’s free.
American Airlines (AAL) Q4 CY2025 Highlights:
- Revenue: $14 billion vs analyst estimates of $14.04 billion (2.5% year-on-year growth, in line)
- Adjusted EPS: $0.16 vs analyst expectations of $0.35 (54.6% miss)
- Adjusted EPS guidance for the upcoming financial year 2026 is $2.20 at the midpoint, beating analyst estimates by 12.1%
- Operating Margin: 3.2%, down from 8.3% in the same quarter last year
- Free Cash Flow was -$1.90 billion compared to -$342 million in the same quarter last year
- Revenue Passenger Miles: 61.6 billion, up 920 million year on year
- Market Capitalization: $9.62 billion
“American Airlines is positioned for significant upside in 2026 and beyond,” said American’s CEO Robert Isom.
Company Overview
One of the ‘Big Four’ airlines in the US, American Airlines (NASDAQ: AAL) is a major global air carrier that serves both business and leisure travelers through its domestic and international flights.
Revenue Growth
A company’s long-term performance is an indicator of its overall quality. Any business can have short-term success, but a top-tier one grows for years. Over the last five years, American Airlines grew its sales at a 25.8% compounded annual growth rate. Although this growth is acceptable on an absolute basis, it fell slightly short of our standards for the consumer discretionary sector, which enjoys a number of secular tailwinds.
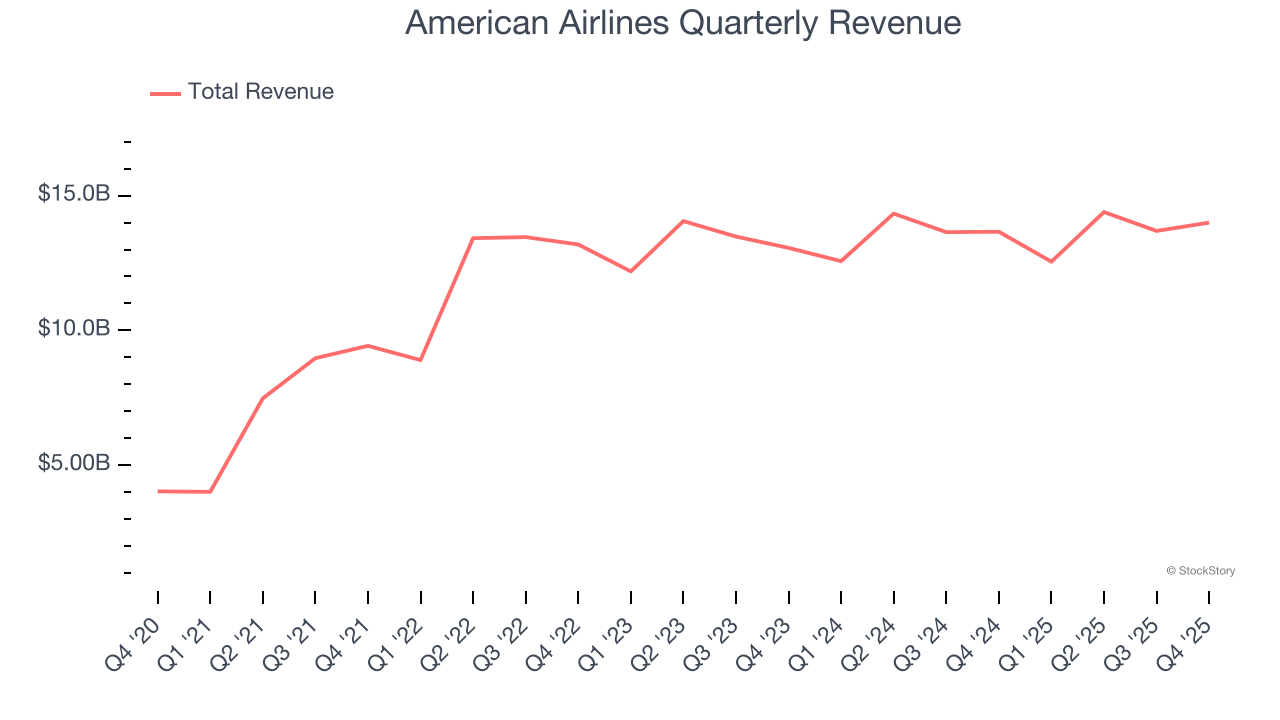
We at StockStory place the most emphasis on long-term growth, but within consumer discretionary, a stretched historical view may miss a company riding a successful new property or trend. American Airlines’s recent performance shows its demand has slowed as its annualized revenue growth of 1.7% over the last two years was below its five-year trend. 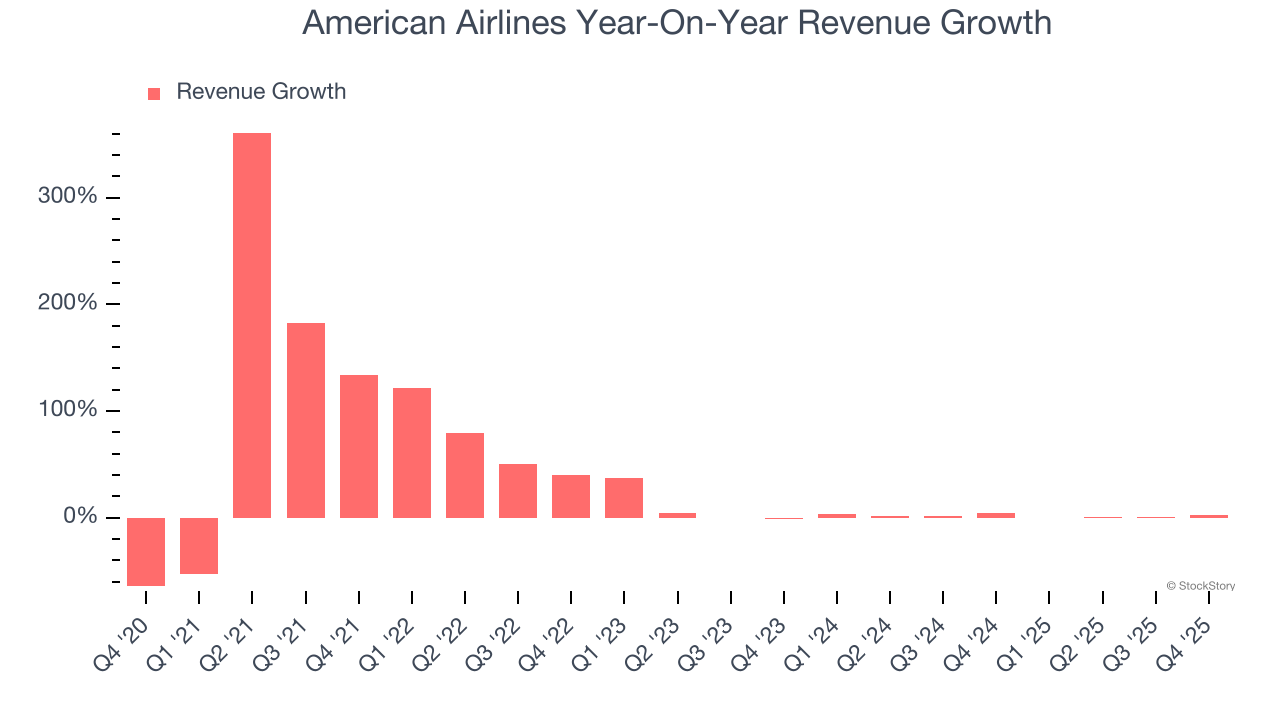
We can better understand the company’s revenue dynamics by analyzing its number of revenue passenger miles, which reached 61.6 billion in the latest quarter. Over the last two years, American Airlines’s revenue passenger miles averaged 4% year-on-year growth. Because this number is higher than its revenue growth during the same period, we can see the company’s monetization has fallen. 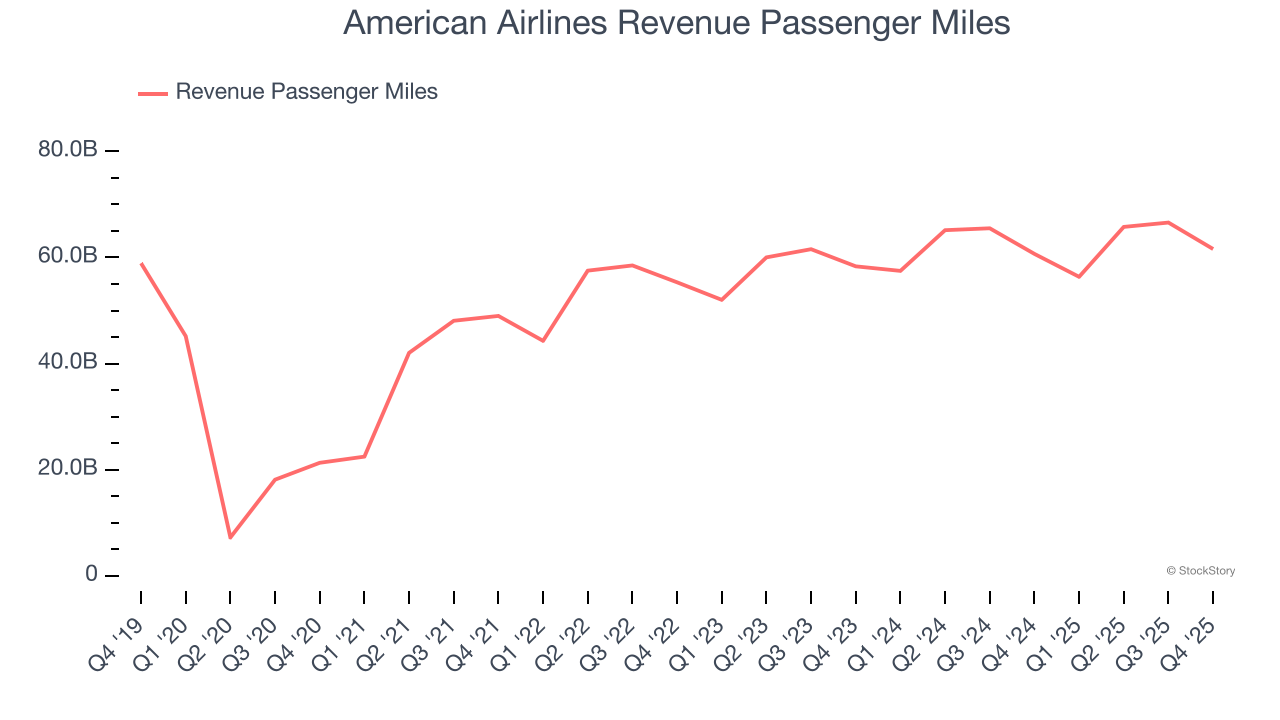
This quarter, American Airlines grew its revenue by 2.5% year on year, and its $14 billion of revenue was in line with Wall Street’s estimates.
Looking ahead, sell-side analysts expect revenue to grow 7.7% over the next 12 months. While this projection implies its newer products and services will catalyze better top-line performance, it is still below the sector average.
While Wall Street chases Nvidia at all-time highs, an under-the-radar semiconductor supplier is dominating a critical AI component these giants can’t build without. Click here to access our free report one of our favorites growth stories.
Operating Margin
American Airlines’s operating margin has shrunk over the last 12 months and averaged 3.7% over the last two years. The company’s profitability was mediocre for a consumer discretionary business and shows it couldn’t pass its higher operating expenses onto its customers.
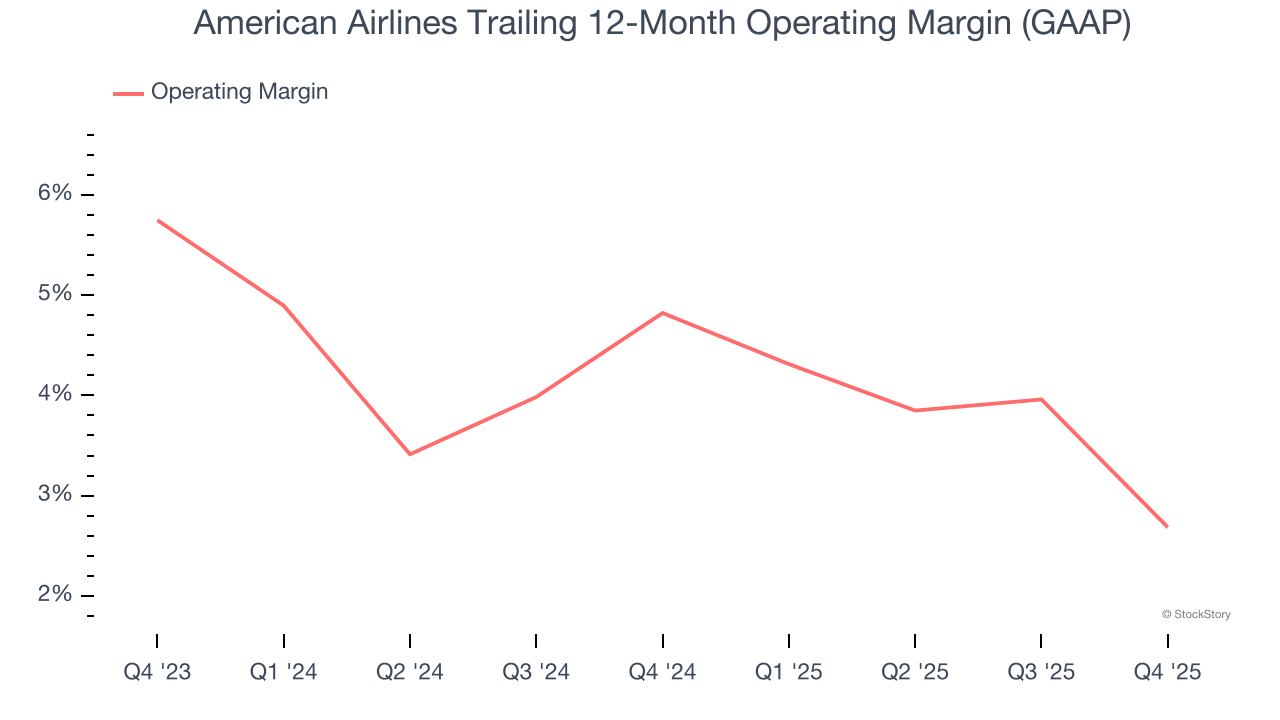
In Q4, American Airlines generated an operating margin profit margin of 3.2%, down 5.1 percentage points year on year. This contraction shows it was less efficient because its expenses grew faster than its revenue.
In the coming year, Wall Street expects American Airlines to become more profitable. Analysts are expecting the company’s trailing 12-month operating margin of 2.7% to rise to 5.2%.
Earnings Per Share
We track the long-term change in earnings per share (EPS) for the same reason as long-term revenue growth. Compared to revenue, however, EPS highlights whether a company’s growth is profitable.
American Airlines’s full-year EPS flipped from negative to positive over the last five years. This is encouraging and shows it’s at a critical moment in its life.
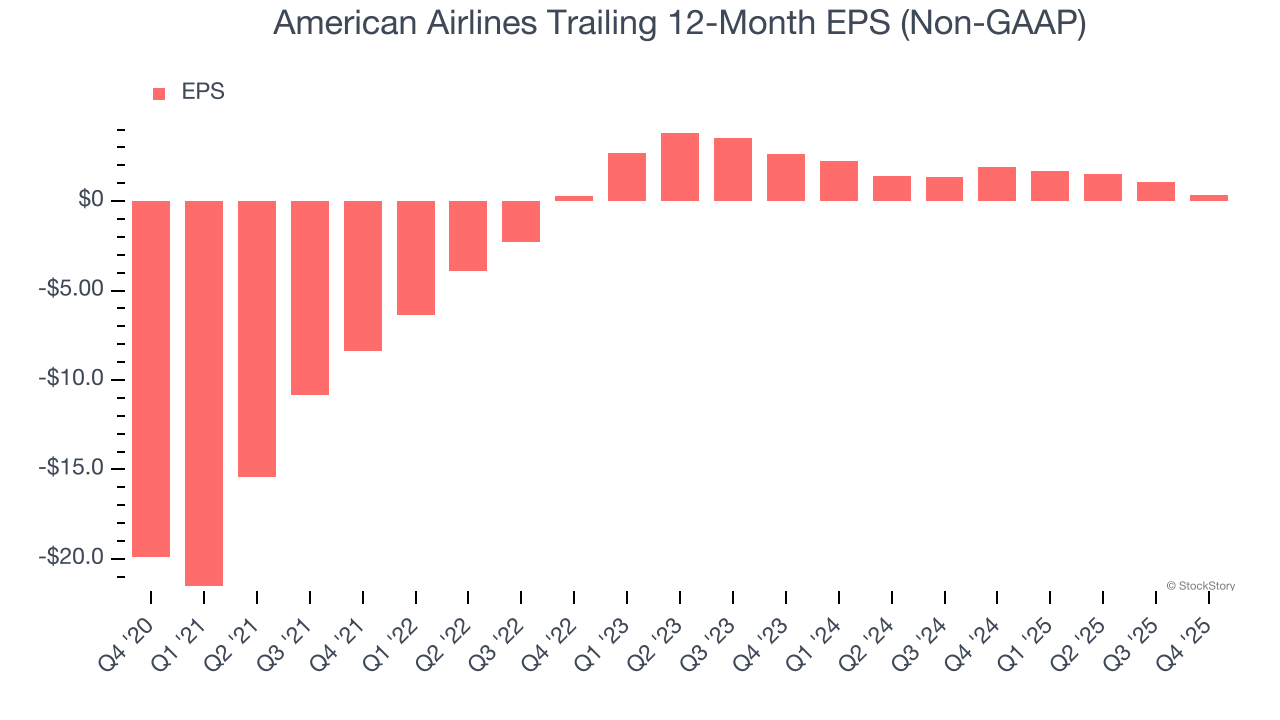
In Q4, American Airlines reported adjusted EPS of $0.16, down from $0.86 in the same quarter last year. This print missed analysts’ estimates. Over the next 12 months, Wall Street expects American Airlines’s full-year EPS of $0.35 to grow 481%.
Key Takeaways from American Airlines’s Q4 Results
We were impressed by American Airlines’s optimistic full-year EPS guidance, which blew past analysts’ expectations. On the other hand, its EPS missed and its number of revenue passenger miles fell short of Wall Street’s estimates. Zooming out, we think this was a mixed quarter. The stock traded up 3.3% to $15.04 immediately following the results.
Is American Airlines an attractive investment opportunity at the current price? What happened in the latest quarter matters, but not as much as longer-term business quality and valuation, when deciding whether to invest in this stock. We cover that in our actionable full research report which you can read here (it’s free).


