Athletic apparel company Under Armour (NYSE: UAA) met Wall Street’s revenue expectations in Q2 CY2025, but sales fell by 4.2% year on year to $1.13 billion. On the other hand, next quarter’s revenue guidance of $1.31 billion was less impressive, coming in 4.1% below analysts’ estimates. Its non-GAAP profit of $0.02 per share was in line with analysts’ consensus estimates.
Is now the time to buy Under Armour? Find out by accessing our full research report, it’s free.
Under Armour (UAA) Q2 CY2025 Highlights:
- Revenue: $1.13 billion vs analyst estimates of $1.13 billion (4.2% year-on-year decline, in line)
- Adjusted EPS: $0.02 vs analyst estimates of $0.03 (in line)
- Adjusted EBITDA: $44.52 million vs analyst estimates of $55.27 million (3.9% margin, 19.4% miss)
- Revenue Guidance for Q3 CY2025 is $1.31 billion at the midpoint, below analyst estimates of $1.36 billion
- Adjusted EPS guidance for Q3 CY2025 is $0.02 at the midpoint, below analyst estimates of $0.26
- Operating Margin: 0.3%, up from -25.3% in the same quarter last year
- Free Cash Flow Margin: 1.2%, down from 9.1% in the same quarter last year
- Constant Currency Revenue fell 4% year on year (-9.9% in the same quarter last year)
- Market Capitalization: $2.75 billion
"We are pleased our quarterly results met or exceeded our expectations as we drive a bold transformation – sharpening Under Armour into a brand where sports credibility, innovation and style meet operational discipline," said Under Armour President and CEO Kevin Plank.
Company Overview
Founded in 1996 by a former University of Maryland football player, Under Armour (NYSE: UAA) is an apparel brand specializing in sportswear designed to improve athletic performance.
Revenue Growth
A company’s long-term sales performance is one signal of its overall quality. Any business can experience short-term success, but top-performing ones enjoy sustained growth for years. Unfortunately, Under Armour’s 2.6% annualized revenue growth over the last five years was weak. This was below our standards and is a rough starting point for our analysis.
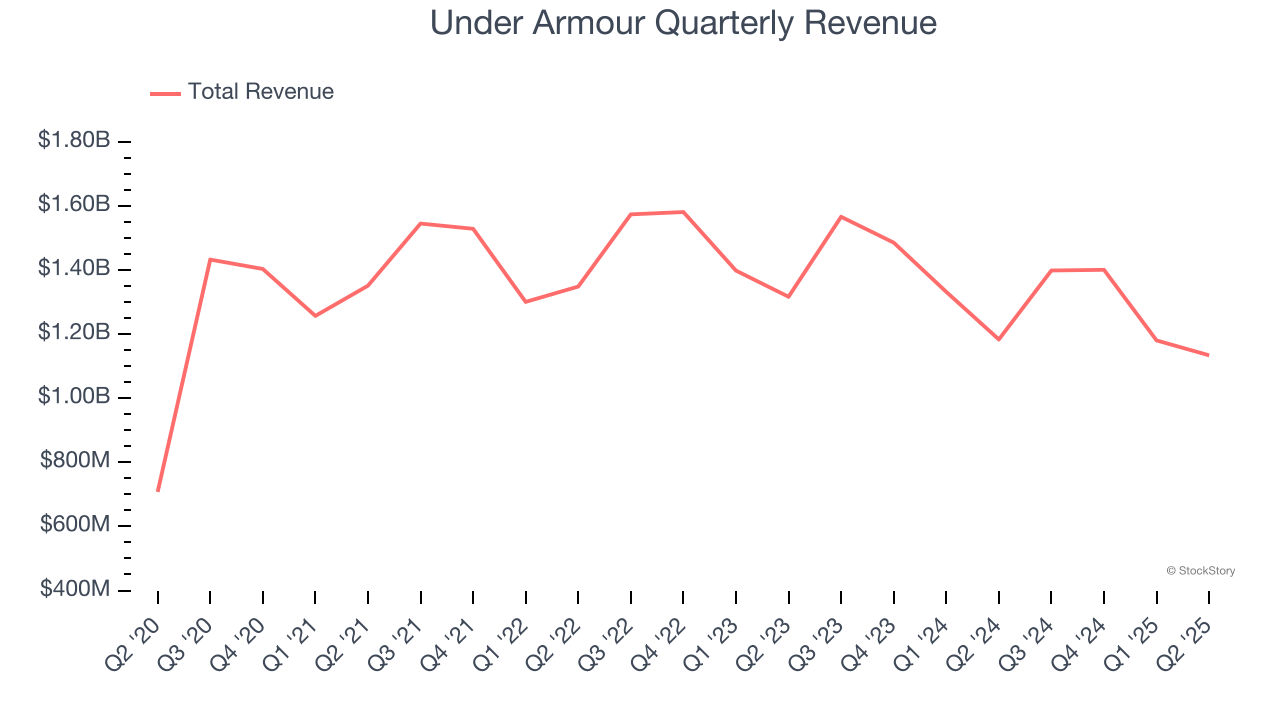
We at StockStory place the most emphasis on long-term growth, but within consumer discretionary, a stretched historical view may miss a company riding a successful new product or trend. Under Armour’s performance shows it grew in the past but relinquished its gains over the last two years, as its revenue fell by 6.7% annually. 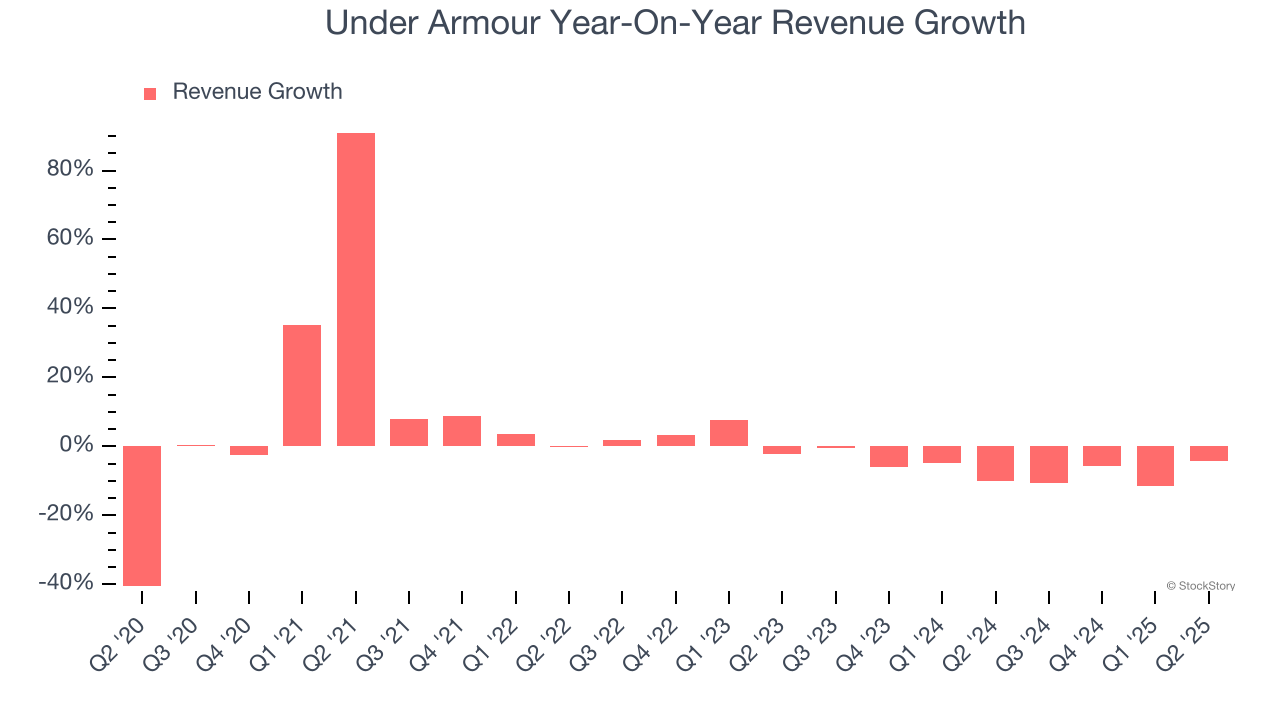
We can dig further into the company’s sales dynamics by analyzing its constant currency revenue, which excludes currency movements that are outside their control and not indicative of demand. Over the last two years, its constant currency sales averaged 6.6% year-on-year declines. Because this number aligns with its normal revenue growth, we can see that Under Armour has properly hedged its foreign currency exposure. 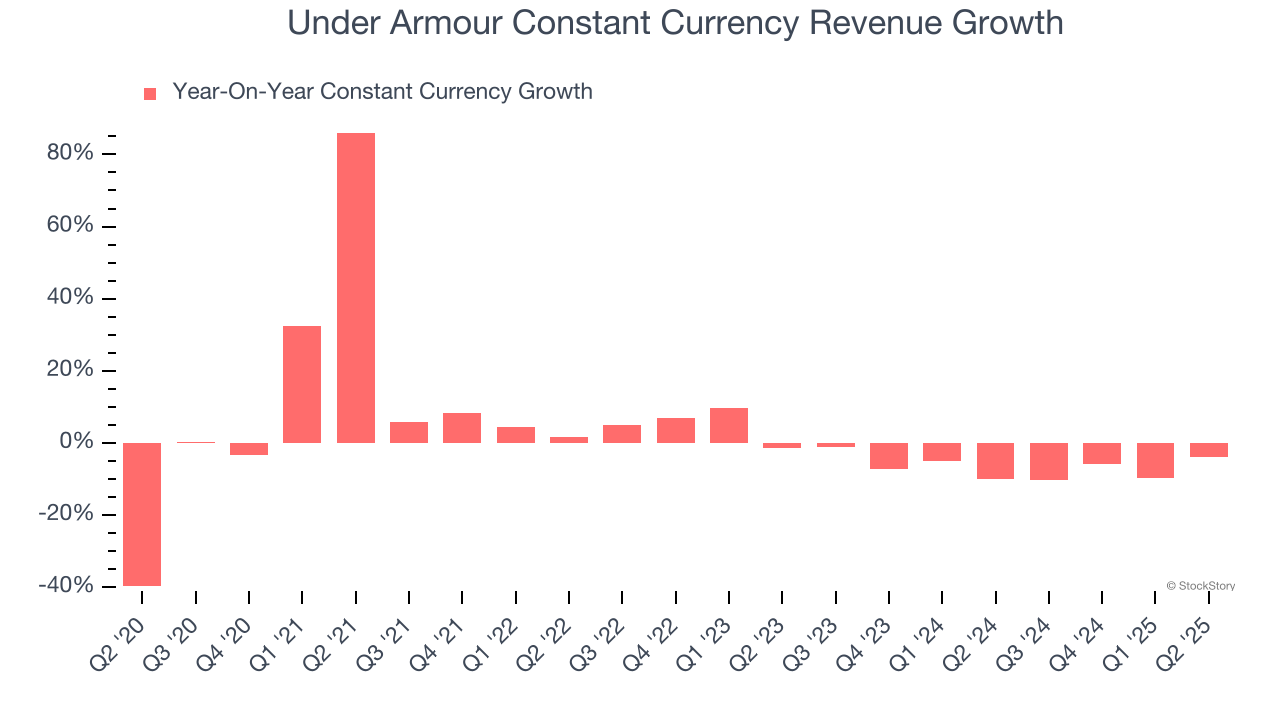
This quarter, Under Armour reported a rather uninspiring 4.2% year-on-year revenue decline to $1.13 billion of revenue, in line with Wall Street’s estimates. Company management is currently guiding for a 6.5% year-on-year decline in sales next quarter.
Looking further ahead, sell-side analysts expect revenue to remain flat over the next 12 months. Although this projection suggests its newer products and services will fuel better top-line performance, it is still below the sector average.
Software is eating the world and there is virtually no industry left that has been untouched by it. That drives increasing demand for tools helping software developers do their jobs, whether it be monitoring critical cloud infrastructure, integrating audio and video functionality, or ensuring smooth content streaming. Click here to access a free report on our 3 favorite stocks to play this generational megatrend.
Operating Margin
Operating margin is an important measure of profitability as it shows the portion of revenue left after accounting for all core expenses – everything from the cost of goods sold to advertising and wages. It’s also useful for comparing profitability across companies with different levels of debt and tax rates because it excludes interest and taxes.
Under Armour’s operating margin has been trending up over the last 12 months, leading to break even profits over the last two years. However, its large expense base and inefficient cost structure mean it still sports inadequate profitability for a consumer discretionary business.
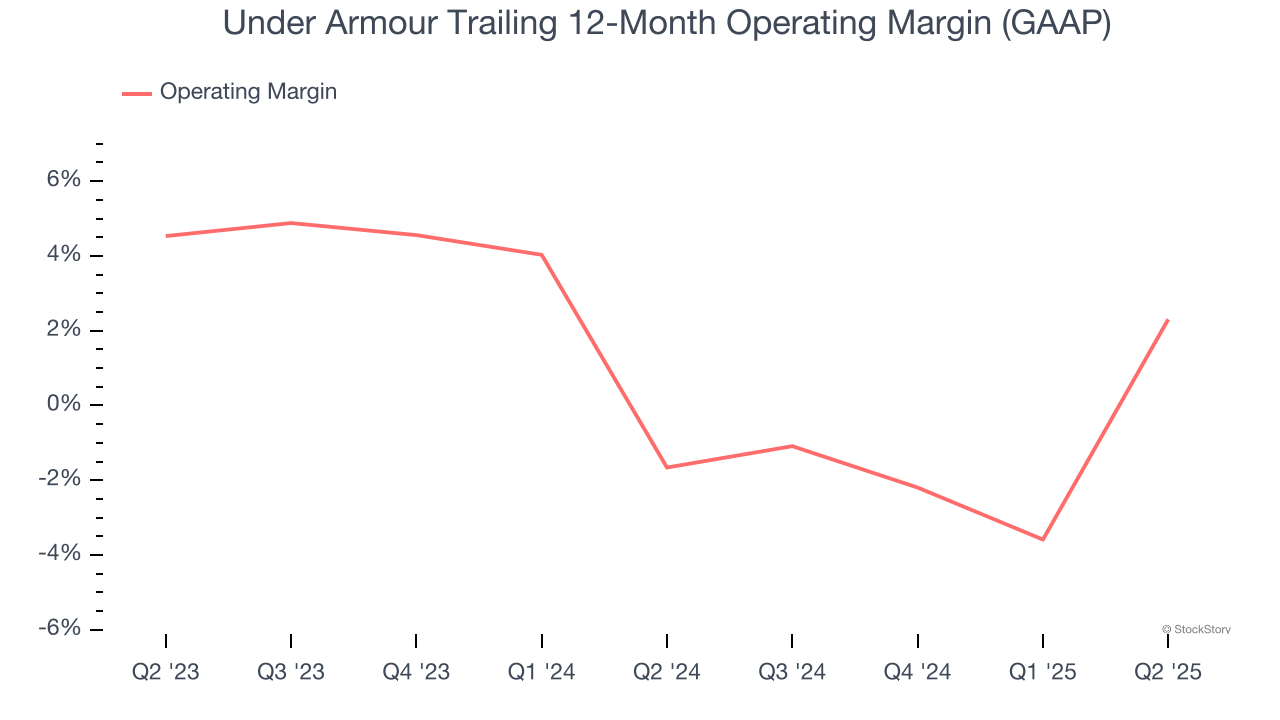
In Q2, Under Armour’s breakeven margin was up 25.6 percentage points year on year. This increase was a welcome development, especially since its revenue fell, showing it was more efficient because it scaled down its expenses.
Earnings Per Share
We track the long-term change in earnings per share (EPS) for the same reason as long-term revenue growth. Compared to revenue, however, EPS highlights whether a company’s growth is profitable.
Under Armour’s full-year EPS flipped from negative to positive over the last five years. This is encouraging and shows it’s at a critical moment in its life.
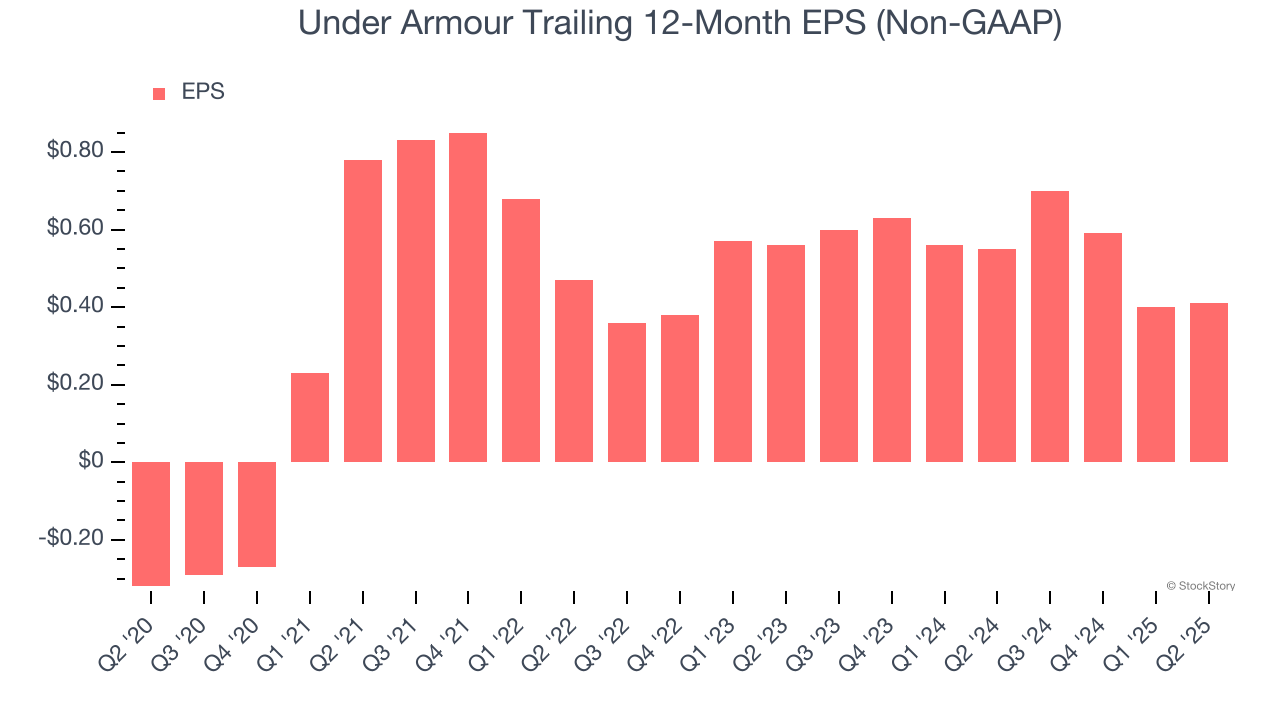
In Q2, Under Armour reported adjusted EPS at $0.02, up from $0.01 in the same quarter last year. Despite growing year on year, this print missed analysts’ estimates, but we care more about long-term adjusted EPS growth than short-term movements. Over the next 12 months, Wall Street expects Under Armour to perform poorly. Analysts forecast its full-year EPS of $0.41 will hit $0.31.
Key Takeaways from Under Armour’s Q2 Results
We struggled to find many positives in these results. Its EPS missed and its EPS guidance for next quarter fell short of Wall Street’s estimates. Overall, this was a softer quarter. The stock traded down 15% to $5.64 immediately following the results.
The latest quarter from Under Armour’s wasn’t that good. One earnings report doesn’t define a company’s quality, though, so let’s explore whether the stock is a buy at the current price. What happened in the latest quarter matters, but not as much as longer-term business quality and valuation, when deciding whether to invest in this stock. We cover that in our actionable full research report which you can read here, it’s free.