Aerospace and defense company Huntington Ingalls (NYSE: HII) beat Wall Street’s revenue expectations in Q2 CY2025, with sales up 3.5% year on year to $3.08 billion. Its GAAP profit of $3.86 per share was 17.2% above analysts’ consensus estimates.
Is now the time to buy Huntington Ingalls? Find out by accessing our full research report, it’s free.
Huntington Ingalls (HII) Q2 CY2025 Highlights:
- Revenue: $3.08 billion vs analyst estimates of $2.93 billion (3.5% year-on-year growth, 5.4% beat)
- EPS (GAAP): $3.86 vs analyst estimates of $3.29 (17.2% beat)
- Operating Margin: 5.3%, down from 6.3% in the same quarter last year
- Free Cash Flow was $730 million, up from -$99 million in the same quarter last year
- Backlog: $56.9 billion at quarter end, up 17.2% year on year
- Market Capitalization: $10.14 billion
“Second quarter results were largely in line with our expectations as we continue to make steady progress on our operational initiatives for 2025. We have seen early signs that targeted investments are helping to stabilize the workforce and supply chain, in support of the broader maritime industrial base," said Chris Kastner, HII’s president and CEO.
Company Overview
Building Nimitz-class aircraft carriers used in active service, Huntington Ingalls (NYSE: HII) develops marine vessels and their mission systems and maintenance services.
Revenue Growth
Examining a company’s long-term performance can provide clues about its quality. Any business can have short-term success, but a top-tier one grows for years. Regrettably, Huntington Ingalls’s sales grew at a tepid 5.3% compounded annual growth rate over the last five years. This fell short of our benchmark for the industrials sector and is a rough starting point for our analysis.
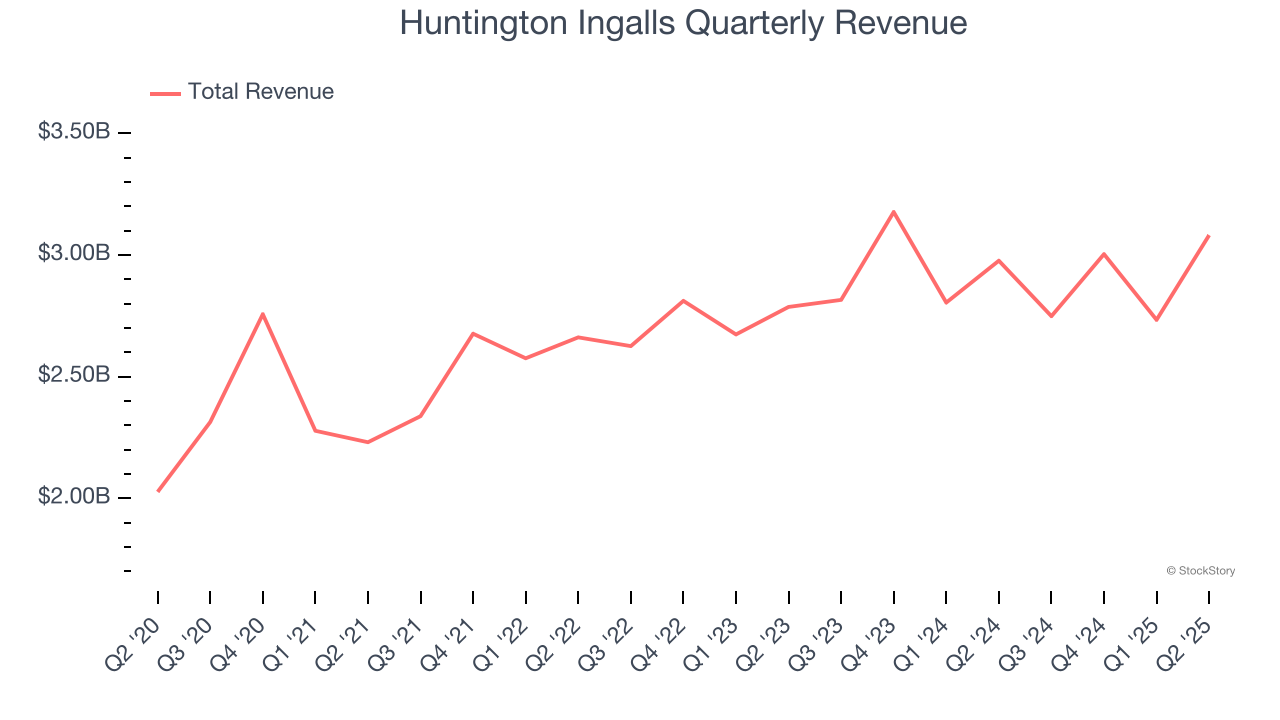
Long-term growth is the most important, but within industrials, a half-decade historical view may miss new industry trends or demand cycles. Huntington Ingalls’s recent performance shows its demand has slowed as its annualized revenue growth of 3% over the last two years was below its five-year trend. 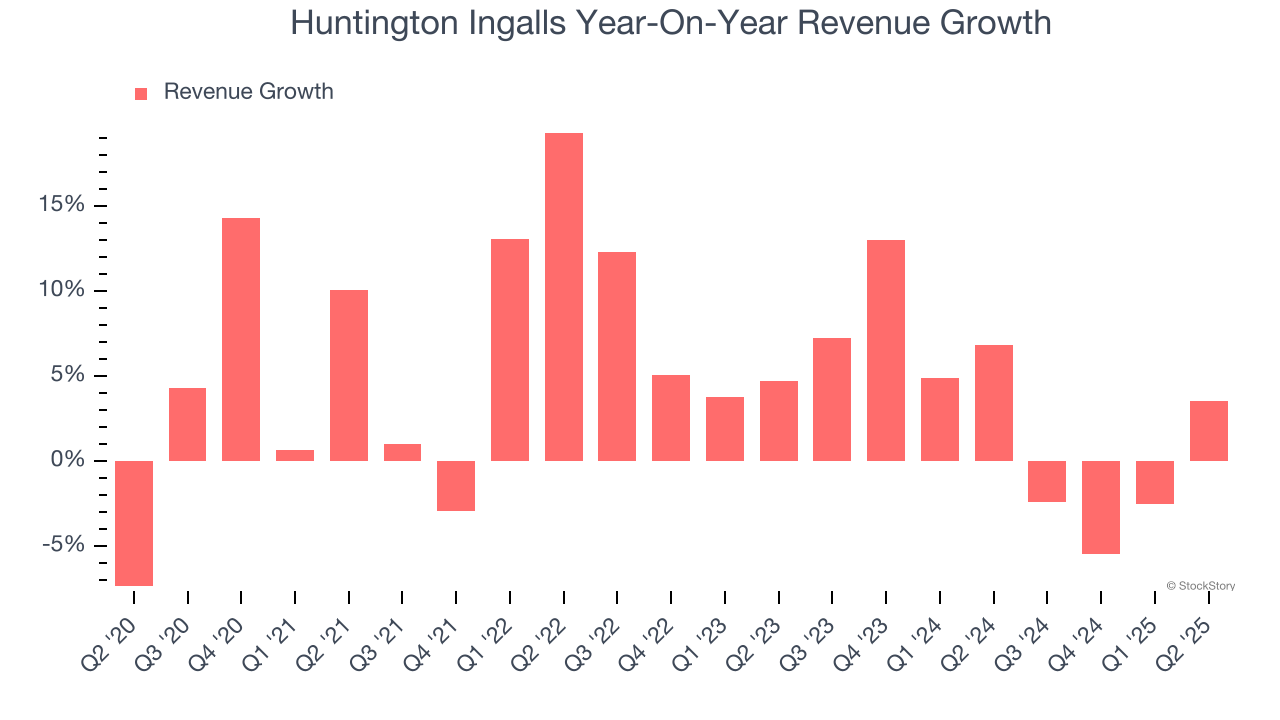
We can better understand the company’s revenue dynamics by analyzing its backlog, or the value of its outstanding orders that have not yet been executed or delivered. Huntington Ingalls’s backlog reached $56.9 billion in the latest quarter and averaged 4% year-on-year growth over the last two years. Because this number is in line with its revenue growth, we can see the company effectively balanced its new order intake and fulfillment processes. 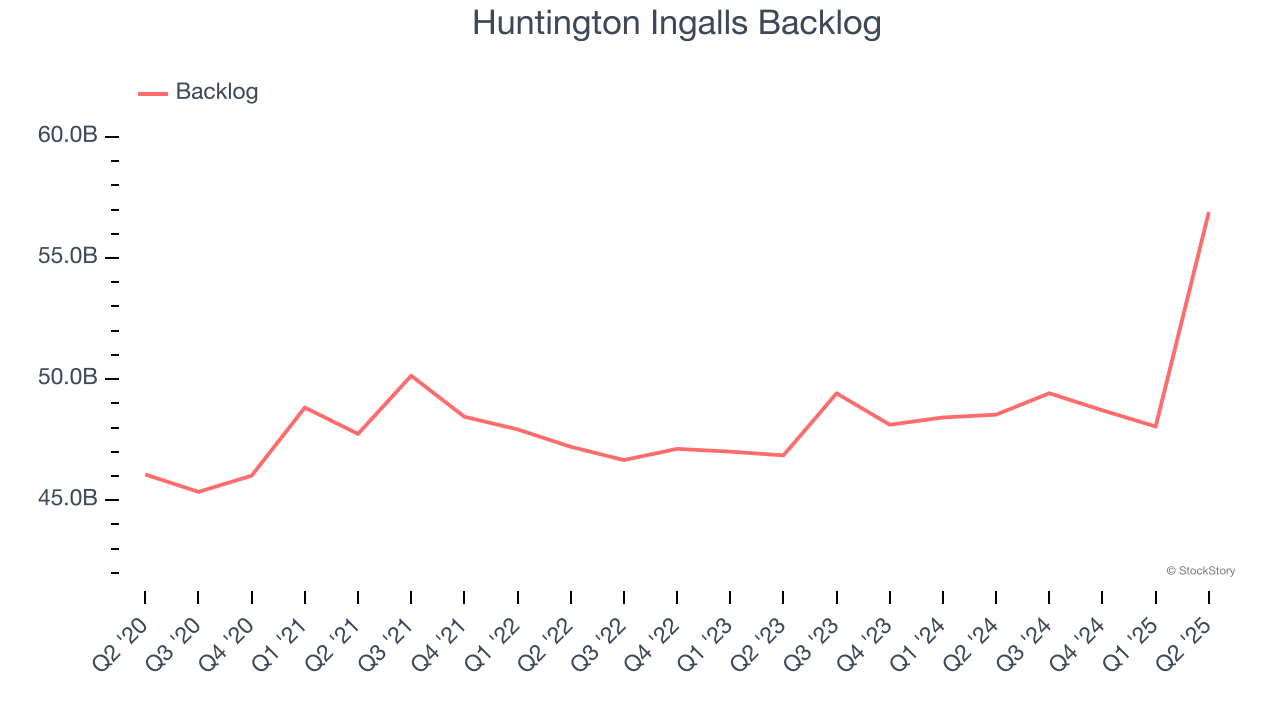
This quarter, Huntington Ingalls reported modest year-on-year revenue growth of 3.5% but beat Wall Street’s estimates by 5.5%.
Looking ahead, sell-side analysts expect revenue to grow 5% over the next 12 months. While this projection indicates its newer products and services will catalyze better top-line performance, it is still below average for the sector.
Software is eating the world and there is virtually no industry left that has been untouched by it. That drives increasing demand for tools helping software developers do their jobs, whether it be monitoring critical cloud infrastructure, integrating audio and video functionality, or ensuring smooth content streaming. Click here to access a free report on our 3 favorite stocks to play this generational megatrend.
Operating Margin
Operating margin is an important measure of profitability as it shows the portion of revenue left after accounting for all core expenses – everything from the cost of goods sold to advertising and wages. It’s also useful for comparing profitability across companies with different levels of debt and tax rates because it excludes interest and taxes.
Huntington Ingalls was profitable over the last five years but held back by its large cost base. Its average operating margin of 6% was weak for an industrials business.
Looking at the trend in its profitability, Huntington Ingalls’s operating margin decreased by 3.9 percentage points over the last five years. This raises questions about the company’s expense base because its revenue growth should have given it leverage on its fixed costs, resulting in better economies of scale and profitability. Huntington Ingalls’s performance was poor no matter how you look at it - it shows that costs were rising and it couldn’t pass them onto its customers.
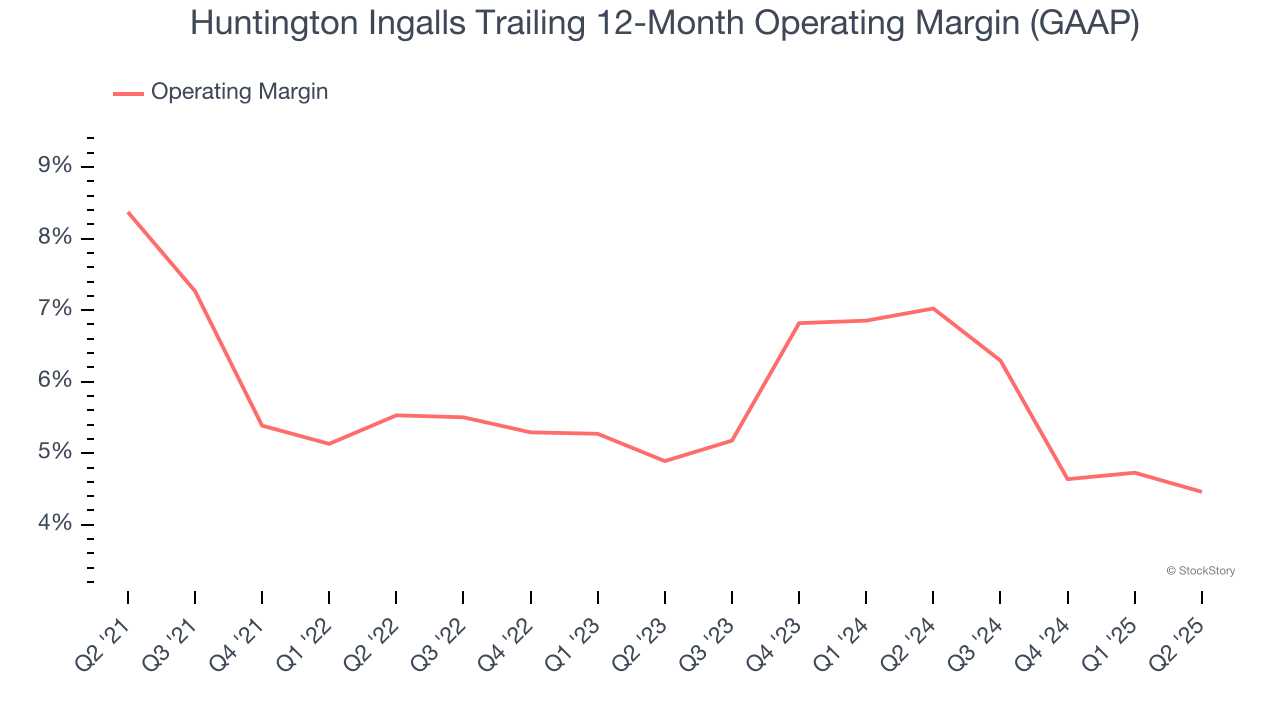
In Q2, Huntington Ingalls generated an operating margin profit margin of 5.3%, down 1.1 percentage points year on year. This reduction is quite minuscule and indicates the company’s overall cost structure has been relatively stable.
Earnings Per Share
Revenue trends explain a company’s historical growth, but the long-term change in earnings per share (EPS) points to the profitability of that growth – for example, a company could inflate its sales through excessive spending on advertising and promotions.
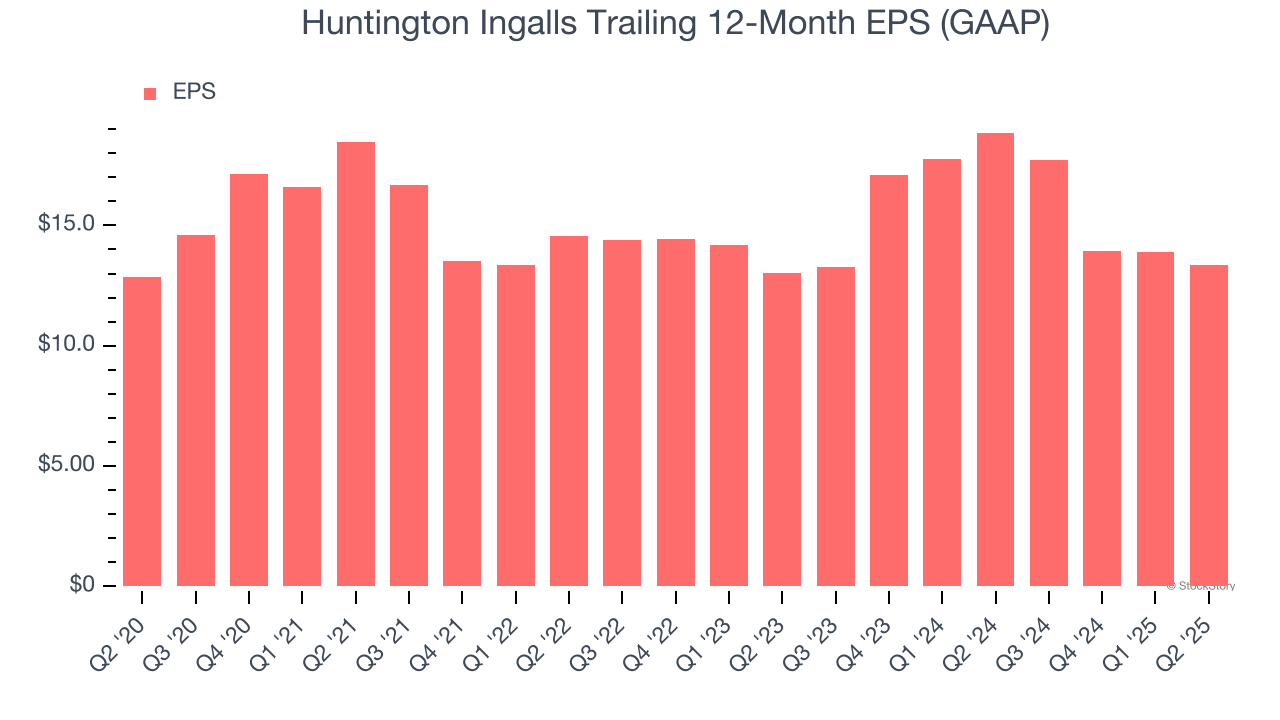
Huntington Ingalls’s flat EPS over the last five years was below its 5.3% annualized revenue growth. We can see the difference stemmed from higher interest expenses or taxes as the company actually improved its operating margin and repurchased its shares during this time.
We can take a deeper look into Huntington Ingalls’s earnings to better understand the drivers of its performance. As we mentioned earlier, Huntington Ingalls’s operating margin declined by 3.9 percentage points over the last five years. This was the most relevant factor (aside from the revenue impact) behind its lower earnings; interest expenses and taxes can also affect EPS but don’t tell us as much about a company’s fundamentals.
Like with revenue, we analyze EPS over a shorter period to see if we are missing a change in the business.
For Huntington Ingalls, its two-year annual EPS growth of 1.3% is similar to its five-year trend, implying stable earnings.
In Q2, Huntington Ingalls reported EPS at $3.86, down from $4.38 in the same quarter last year. Despite falling year on year, this print easily cleared analysts’ estimates. Over the next 12 months, Wall Street expects Huntington Ingalls’s full-year EPS of $13.35 to grow 14.5%.
Key Takeaways from Huntington Ingalls’s Q2 Results
We were impressed by how significantly Huntington Ingalls blew past analysts’ revenue expectations this quarter. We were also glad its EPS outperformed Wall Street’s estimates. Zooming out, we think this was a solid print. The stock traded up 4.8% to $270.99 immediately following the results.
Huntington Ingalls had an encouraging quarter, but one earnings result doesn’t necessarily make the stock a buy. Let’s see if this is a good investment. The latest quarter does matter, but not nearly as much as longer-term fundamentals and valuation, when deciding if the stock is a buy. We cover that in our actionable full research report which you can read here, it’s free.