Semi trailers and liquid transportation container manufacturer Wabash (NYSE: WNC) reported Q2 CY2025 results topping the market’s revenue expectations, but sales fell by 16.7% year on year to $458.8 million. On the other hand, the company’s full-year revenue guidance of $1.6 billion at the midpoint came in 6.5% below analysts’ estimates. Its non-GAAP loss of $0.15 per share was 55.4% above analysts’ consensus estimates.
Is now the time to buy Wabash? Find out by accessing our full research report, it’s free.
Wabash (WNC) Q2 CY2025 Highlights:
- Revenue: $458.8 million vs analyst estimates of $433.8 million (16.7% year-on-year decline, 5.8% beat)
- Adjusted EPS: -$0.15 vs analyst estimates of -$0.34 (55.4% beat)
- Adjusted EBITDA: $16.32 million vs analyst estimates of $8.3 million (3.6% margin, 96.6% beat)
- The company dropped its revenue guidance for the full year to $1.6 billion at the midpoint from $1.8 billion, a 11.1% decrease
- Management lowered its full-year Adjusted EPS guidance to -$1.15 at the midpoint, a 91.7% decrease
- Operating Margin: -1%, down from 7.9% in the same quarter last year
- Free Cash Flow was -$8.25 million compared to -$6.08 million in the same quarter last year
- Backlog: $1 billion at quarter end, down 23.1% year on year
- Market Capitalization: $446.3 million
Company Overview
With its first trailer reportedly built on two sawhorses, Wabash (NYSE: WNC) offers semi trailers, liquid transportation containers, truck bodies, and equipment for moving goods.
Revenue Growth
A company’s long-term sales performance is one signal of its overall quality. Any business can put up a good quarter or two, but many enduring ones grow for years. Wabash’s demand was weak over the last five years as its sales fell at a 1.8% annual rate. This wasn’t a great result and is a sign of poor business quality.
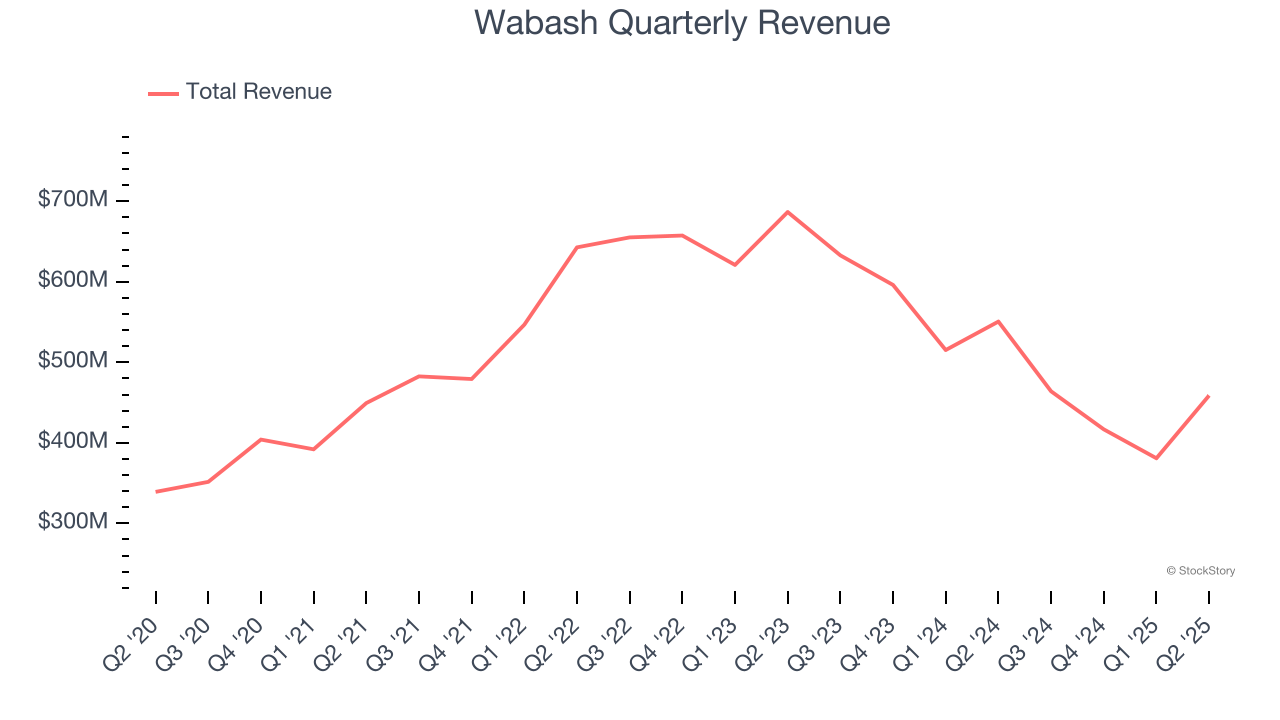
Long-term growth is the most important, but within industrials, a half-decade historical view may miss new industry trends or demand cycles. Wabash’s recent performance shows its demand remained suppressed as its revenue has declined by 19% annually over the last two years. Wabash isn’t alone in its struggles as the Heavy Transportation Equipment industry experienced a cyclical downturn, with many similar businesses observing lower sales at this time. 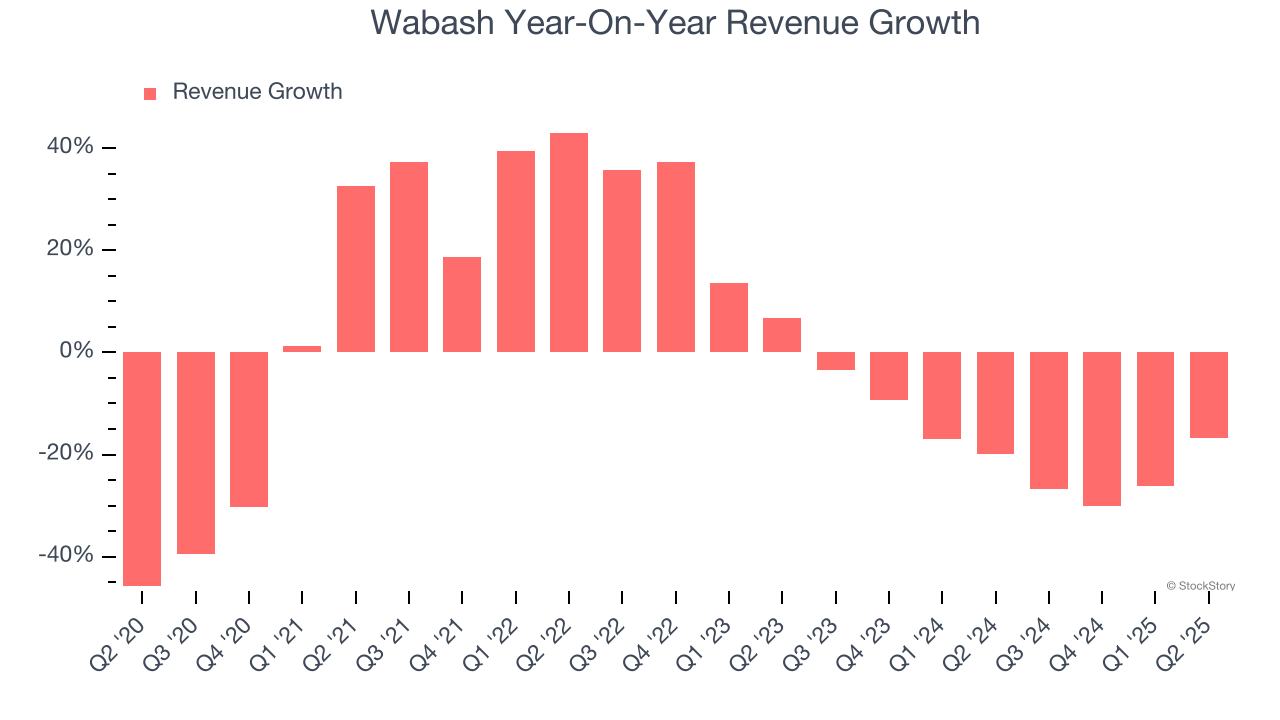
We can dig further into the company’s revenue dynamics by analyzing its backlog, or the value of its outstanding orders that have not yet been executed or delivered. Wabash’s backlog reached $1 billion in the latest quarter and averaged 36.2% year-on-year declines over the last two years. Because this number is lower than its revenue growth, we can see the company hasn’t secured enough new orders to maintain its growth rate in the future. 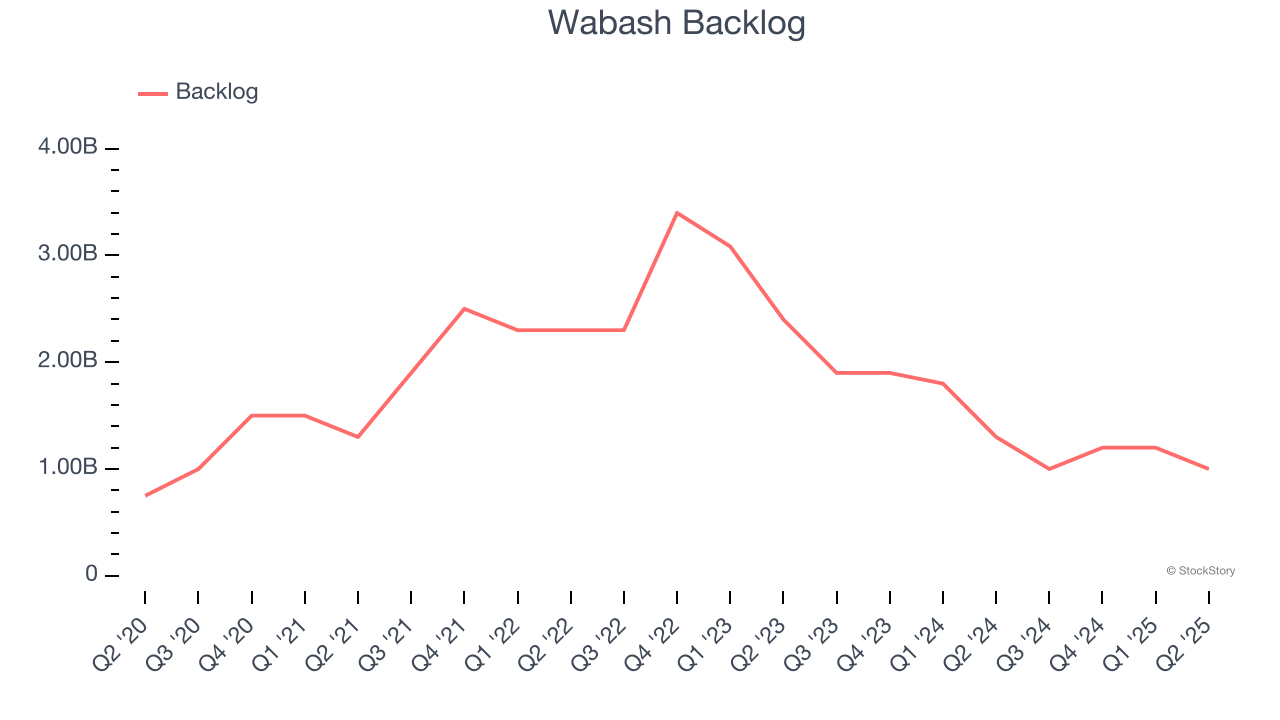
This quarter, Wabash’s revenue fell by 16.7% year on year to $458.8 million but beat Wall Street’s estimates by 5.8%.
Looking ahead, sell-side analysts expect revenue to grow 13.1% over the next 12 months, an improvement versus the last two years. This projection is commendable and suggests its newer products and services will fuel better top-line performance.
Today’s young investors won’t have read the timeless lessons in Gorilla Game: Picking Winners In High Technology because it was written more than 20 years ago when Microsoft and Apple were first establishing their supremacy. But if we apply the same principles, then enterprise software stocks leveraging their own generative AI capabilities may well be the Gorillas of the future. So, in that spirit, we are excited to present our Special Free Report on a profitable, fast-growing enterprise software stock that is already riding the automation wave and looking to catch the generative AI next.
Operating Margin
Wabash was profitable over the last five years but held back by its large cost base. Its average operating margin of 4.7% was weak for an industrials business. This result isn’t too surprising given its low gross margin as a starting point.
Analyzing the trend in its profitability, Wabash’s operating margin decreased by 10.2 percentage points over the last five years. Wabash’s performance was poor no matter how you look at it - it shows that costs were rising and it couldn’t pass them onto its customers.
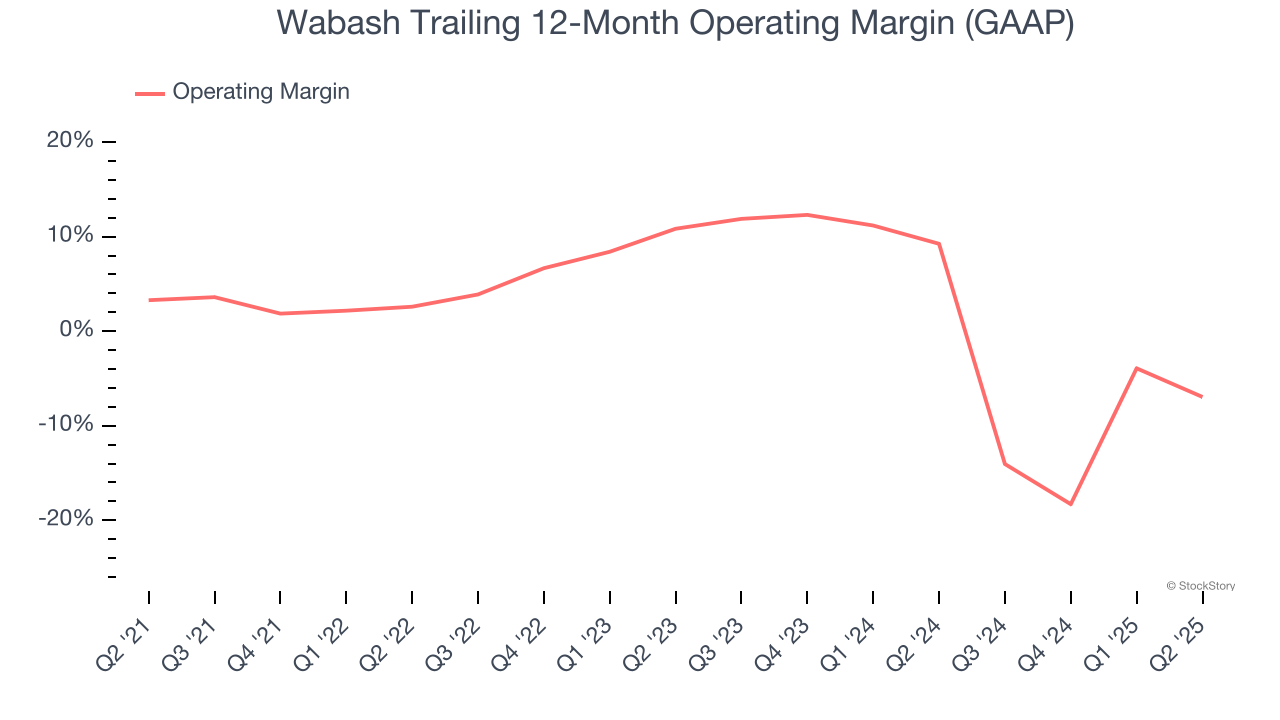
In Q2, Wabash generated an operating margin profit margin of negative 1%, down 9 percentage points year on year. Since Wabash’s operating margin decreased more than its gross margin, we can assume it was less efficient because expenses such as marketing, R&D, and administrative overhead increased.
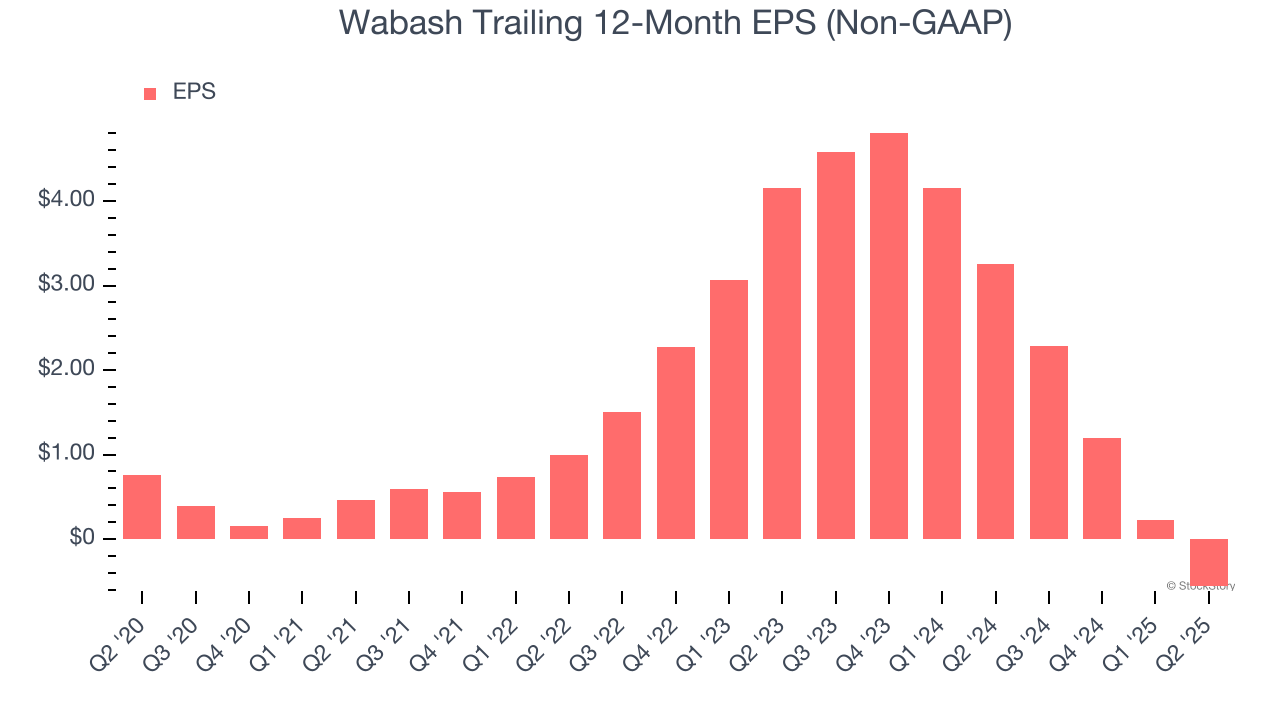
Earnings Per Share
Revenue trends explain a company’s historical growth, but the long-term change in earnings per share (EPS) points to the profitability of that growth – for example, a company could inflate its sales through excessive spending on advertising and promotions.
Sadly for Wabash, its EPS declined by 22.3% annually over the last five years, more than its revenue. This tells us the company struggled because its fixed cost base made it difficult to adjust to shrinking demand.
We can take a deeper look into Wabash’s earnings to better understand the drivers of its performance. As we mentioned earlier, Wabash’s operating margin declined by 10.2 percentage points over the last five years. This was the most relevant factor (aside from the revenue impact) behind its lower earnings; interest expenses and taxes can also affect EPS but don’t tell us as much about a company’s fundamentals.
Like with revenue, we analyze EPS over a more recent period because it can provide insight into an emerging theme or development for the business.
For Wabash, its two-year annual EPS declines of 46.1% show it’s continued to underperform. These results were bad no matter how you slice the data.
In Q2, Wabash reported EPS at negative $0.15, down from $0.64 in the same quarter last year. Despite falling year on year, this print easily cleared analysts’ estimates. Over the next 12 months, Wall Street is optimistic. Analysts forecast Wabash’s full-year EPS of negative $0.56 will flip to positive $0.71.
Key Takeaways from Wabash’s Q2 Results
The quarter itself was fine, with EPS beating. On the other hand, the company lowered its full-year guidance, which is always a big negative. Shares traded down 6.9% to $9.95 immediately after reporting.
Is Wabash an attractive investment opportunity at the current price? The latest quarter does matter, but not nearly as much as longer-term fundamentals and valuation, when deciding if the stock is a buy. We cover that in our actionable full research report which you can read here, it’s free.