
Healthcare diagnostics company QuidelOrtho (NASDAQ: QDEL) reported Q4 CY2024 results topping the market’s revenue expectations, but sales fell by 4.7% year on year to $707.8 million. On the other hand, the company’s full-year revenue guidance of $2.71 billion at the midpoint came in 2.2% below analysts’ estimates. Its non-GAAP profit of $0.63 per share was 8.5% above analysts’ consensus estimates.
Is now the time to buy QuidelOrtho? Find out by accessing our full research report, it’s free.
QuidelOrtho (QDEL) Q4 CY2024 Highlights:
- Revenue: $707.8 million vs analyst estimates of $698.4 million (4.7% year-on-year decline, 1.4% beat)
- Adjusted EPS: $0.63 vs analyst estimates of $0.58 (8.5% beat)
- Adjusted EBITDA: $150.3 million vs analyst estimates of $147.3 million (21.2% margin, 2% beat)
- Management’s revenue guidance for the upcoming financial year 2025 is $2.71 billion at the midpoint, missing analyst estimates by 2.2% and implying -2.8% growth (vs -6.8% in FY2024)
- Adjusted EPS guidance for the upcoming financial year 2025 is $2.32 at the midpoint, missing analyst estimates by 5.3%
- EBITDA guidance for the upcoming financial year 2025 is $595 million at the midpoint, above analyst estimates of $589.4 million
- Operating Margin: -14.2%, down from 5.4% in the same quarter last year
- Constant Currency Revenue fell 4.4% year on year (-14.1% in the same quarter last year)
- Market Capitalization: $2.79 billion
“We are pleased with our 2024 business performance and ended the year with positive momentum leading into 2025,” said Brian J. Blaser, President and Chief Executive Officer, QuidelOrtho.
Company Overview
Founded in 1979, QuidelOrtho (NASDAQ: QDEL) develops and manufactures diagnostic solutions, focusing on rapid diagnostic tests for infectious diseases, including COVID-19, and other critical conditions.
Medical Devices & Supplies - Imaging, Diagnostics
The medical devices and supplies industry, particularly those specializing in imaging and diagnostics, operates with a comparatively stable yet capital-intensive business model. Companies in this space benefit from consistent demand driven by the essential nature of diagnostic tools in patient care, as well as recurring revenue streams from consumables, service contracts, and equipment maintenance. However, the industry faces challenges such as significant upfront development costs, stringent regulatory requirements, and pricing pressures from hospitals and healthcare systems, which are increasingly focused on cost containment. Looking ahead, the industry should enjoy tailwinds from advancements in technology, including the integration of artificial intelligence to enhance diagnostic accuracy and workflow efficiency, as well as rising demand for imaging solutions driven by aging populations. On the other hand, headwinds could arise from a rethinking of healthcare costs potentially resulting in reimbursement cuts and slower capital equipment purchasing. Additionally, cybersecurity concerns surrounding connected medical devices could introduce new risks and complexities for manufacturers.
Sales Growth
A company’s long-term performance is an indicator of its overall quality. While any business can experience short-term success, top-performing ones enjoy sustained growth for years. Thankfully, QuidelOrtho’s 39.1% annualized revenue growth over the last five years was incredible. Its growth beat the average healthcare company and shows its offerings resonate with customers.
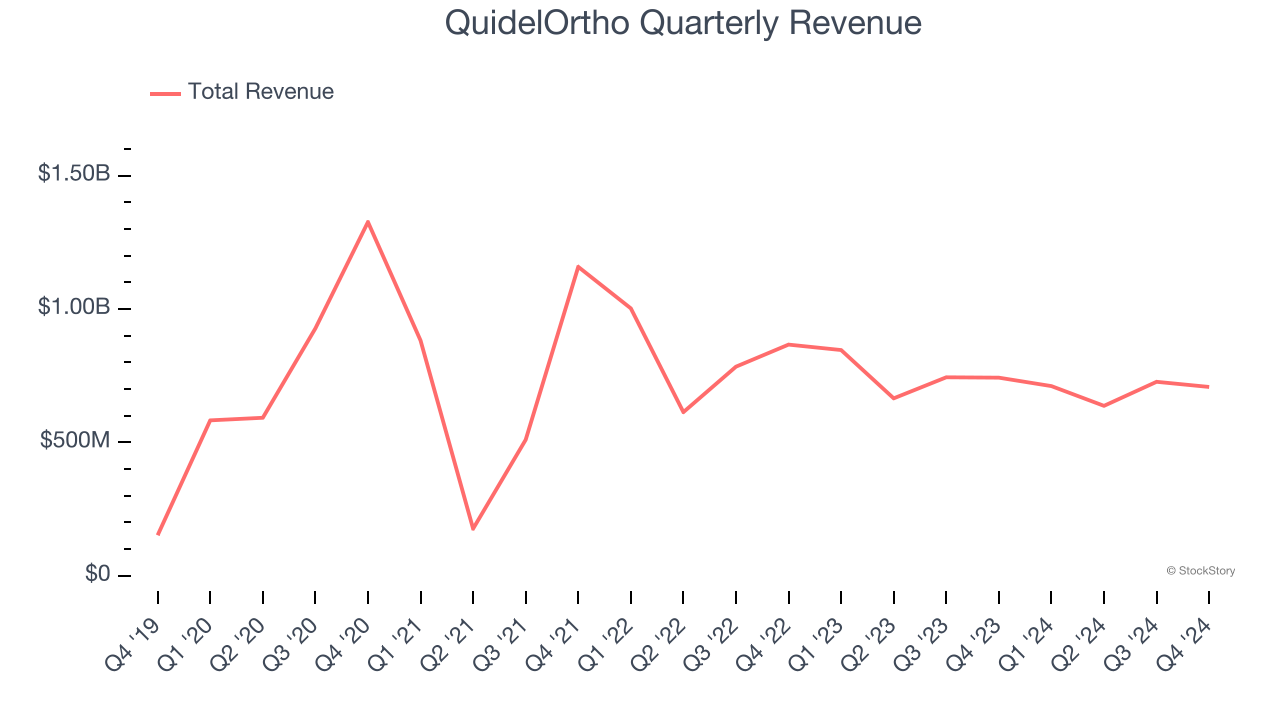
We at StockStory place the most emphasis on long-term growth, but within healthcare, a half-decade historical view may miss recent innovations or disruptive industry trends. QuidelOrtho’s recent history marks a sharp pivot from its five-year trend as its revenue has shown annualized declines of 7.7% over the last two years. 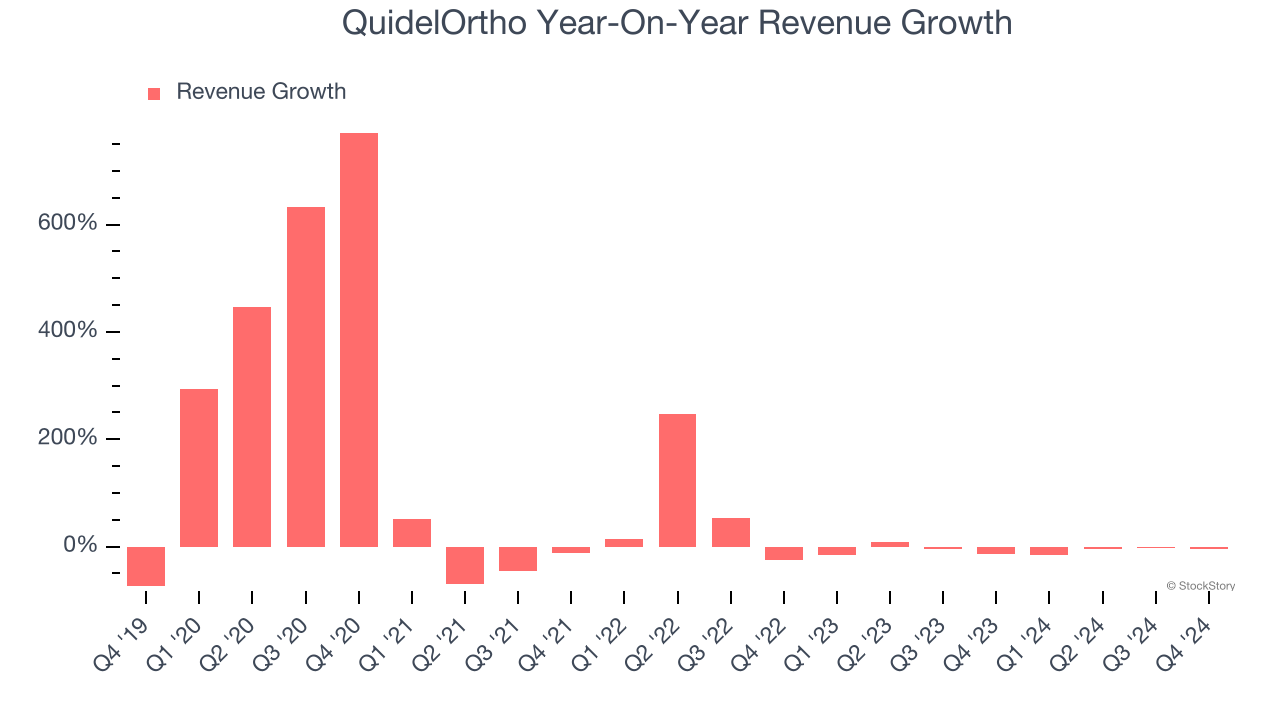
We can dig further into the company’s sales dynamics by analyzing its constant currency revenue, which excludes currency movements that are outside their control and not indicative of demand. Over the last two years, its constant currency sales averaged 14.1% year-on-year declines. Because this number is lower than its normal revenue growth, we can see that foreign exchange rates have boosted QuidelOrtho’s performance. 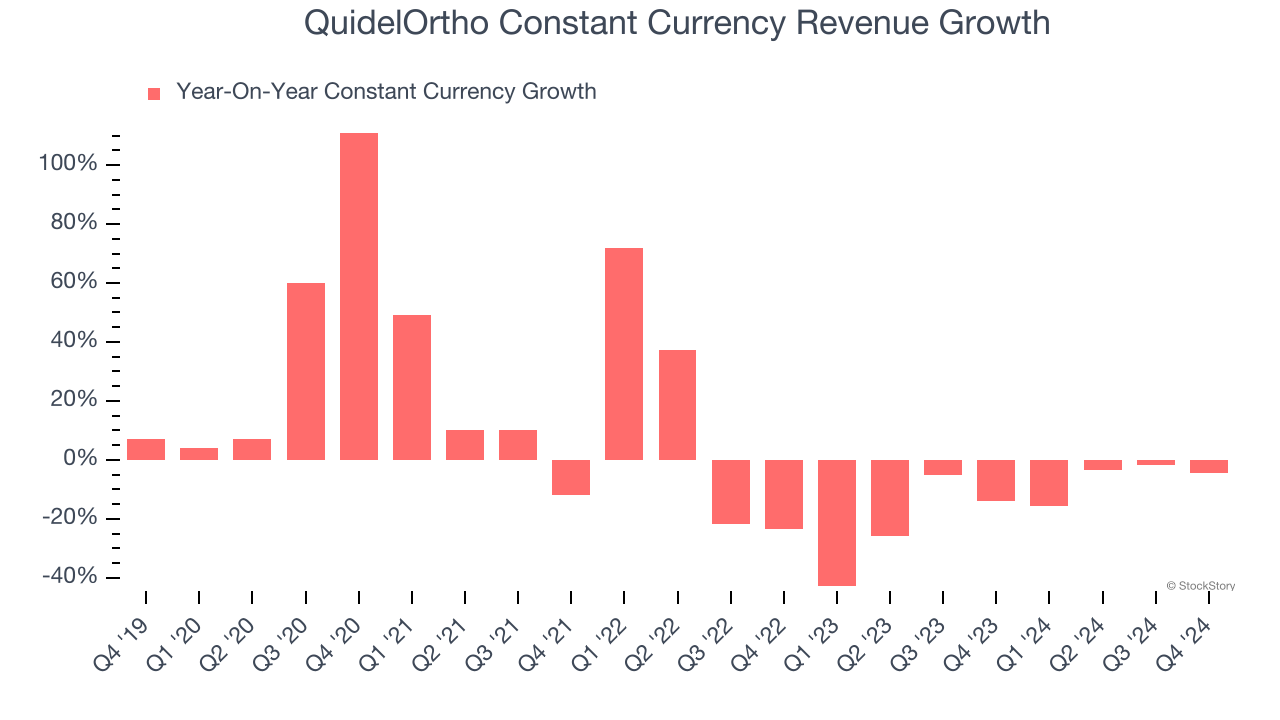
This quarter, QuidelOrtho’s revenue fell by 4.7% year on year to $707.8 million but beat Wall Street’s estimates by 1.4%.
Looking ahead, sell-side analysts expect revenue to remain flat over the next 12 months. Although this projection indicates its newer products and services will catalyze better top-line performance, it is still below the sector average.
Software is eating the world and there is virtually no industry left that has been untouched by it. That drives increasing demand for tools helping software developers do their jobs, whether it be monitoring critical cloud infrastructure, integrating audio and video functionality, or ensuring smooth content streaming. Click here to access a free report on our 3 favorite stocks to play this generational megatrend.
Operating Margin
Operating margin is one of the best measures of profitability because it tells us how much money a company takes home after subtracting all core expenses, like marketing and R&D.
QuidelOrtho was profitable over the last five years but held back by its large cost base. Its average operating margin of 7.1% was weak for a healthcare business.
Looking at the trend in its profitability, QuidelOrtho’s operating margin decreased significantly over the last five years. The company’s two-year trajectory also shows it failed to get its profitability back to the peak as its margin fell by 96.3 percentage points. This performance was poor no matter how you look at it - it shows operating expenses were rising and it couldn’t pass those costs onto its customers.
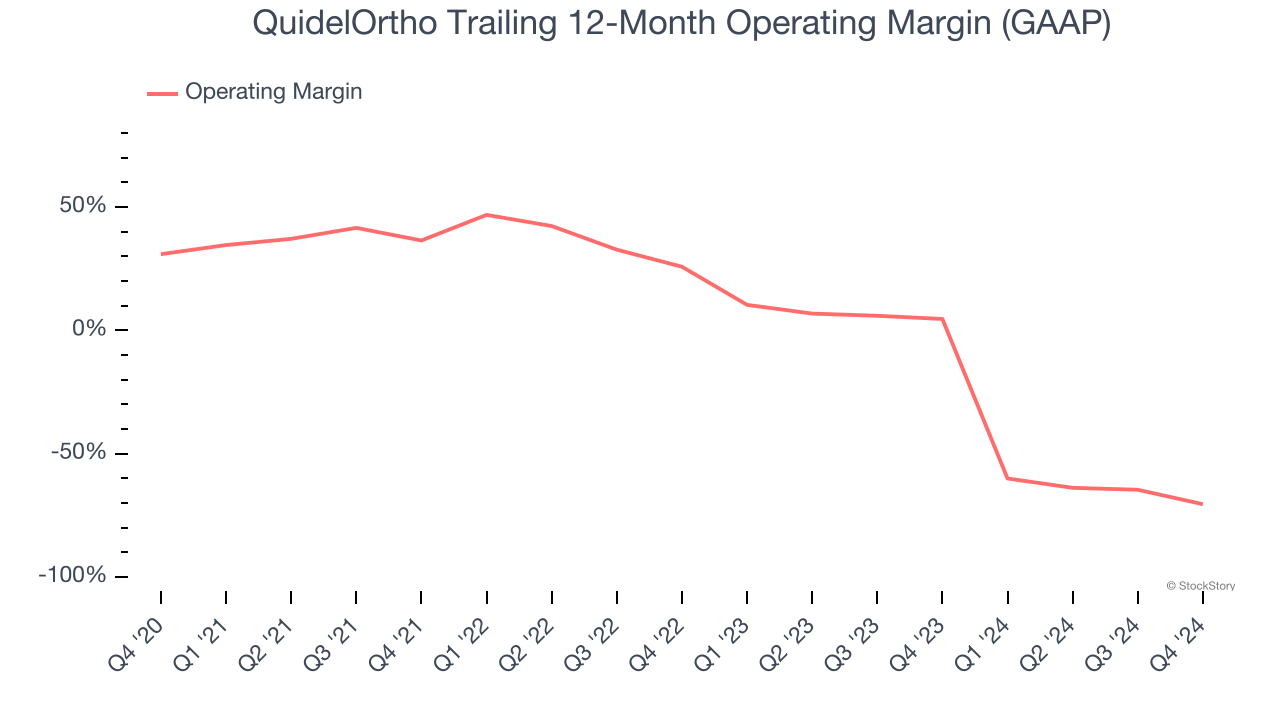
In Q4, QuidelOrtho generated an operating profit margin of negative 14.2%, down 19.6 percentage points year on year. This contraction shows it was recently less efficient because its expenses increased relative to its revenue.
Earnings Per Share
Revenue trends explain a company’s historical growth, but the long-term change in earnings per share (EPS) points to the profitability of that growth – for example, a company could inflate its sales through excessive spending on advertising and promotions.
Sadly for QuidelOrtho, its EPS declined by 9% annually over the last five years while its revenue grew by 39.1%. This tells us the company became less profitable on a per-share basis as it expanded.
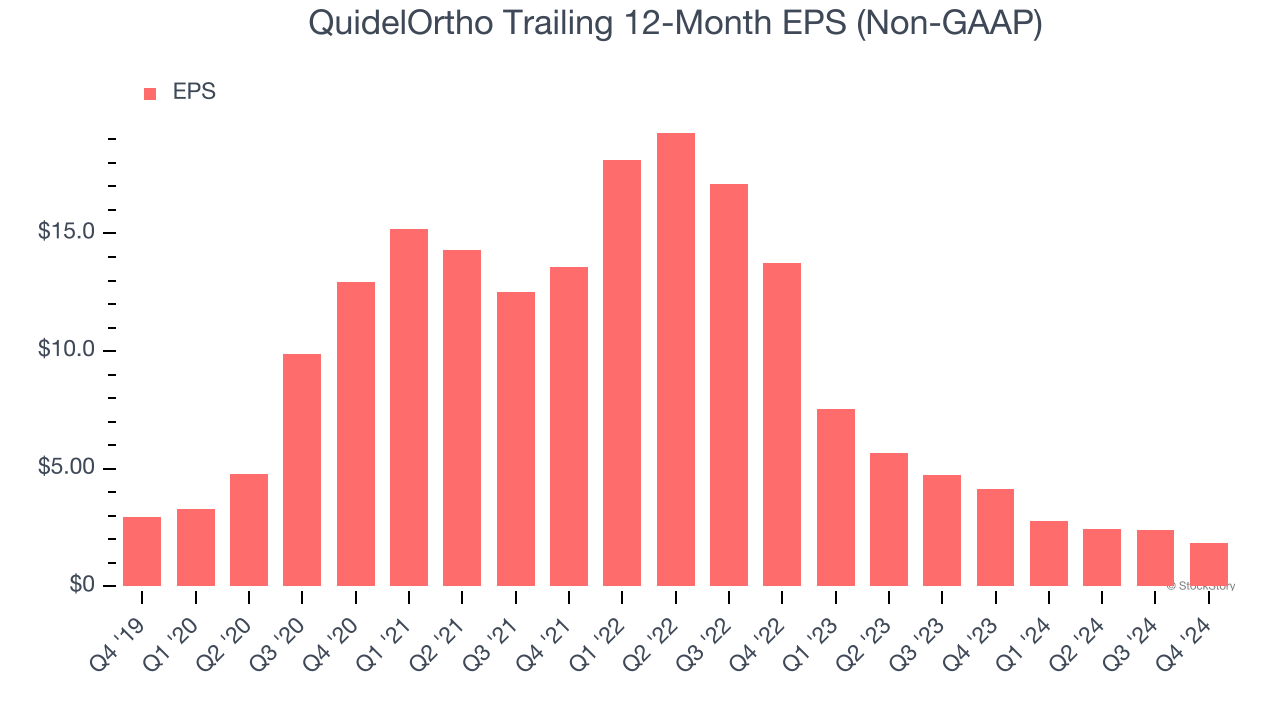
Diving into the nuances of QuidelOrtho’s earnings can give us a better understanding of its performance. As we mentioned earlier, QuidelOrtho’s operating margin declined by 101.4 percentage points over the last five years. Its share count also grew by 55.5%, meaning the company not only became less efficient with its operating expenses but also diluted its shareholders. 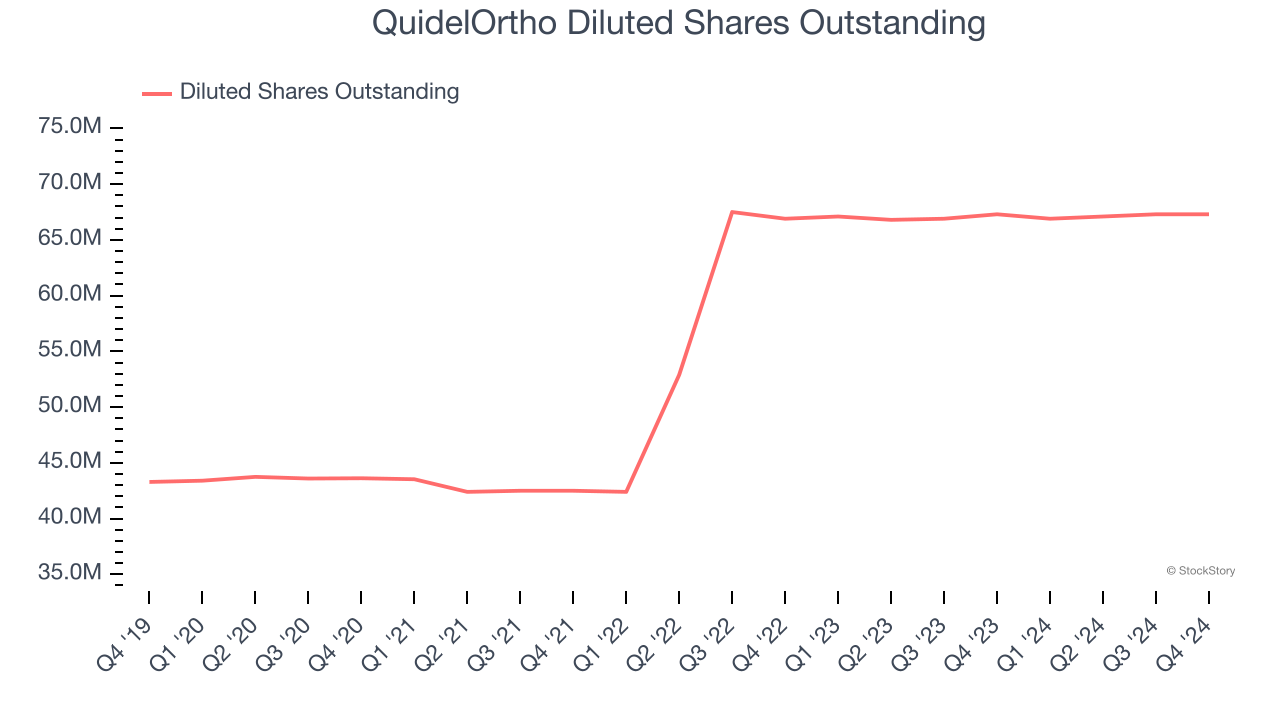
In Q4, QuidelOrtho reported EPS at $0.63, down from $1.17 in the same quarter last year. Despite falling year on year, this print beat analysts’ estimates by 8.5%. Over the next 12 months, Wall Street expects QuidelOrtho’s full-year EPS of $1.85 to grow 32.5%.
Key Takeaways from QuidelOrtho’s Q4 Results
It was good to see QuidelOrtho narrowly top analysts’ constant currency revenue, EPS, and EBITDA expectations this quarter. On the other hand, its full-year revenue and EPS guidance fell short of Wall Street’s estimates. Overall, this was a softer quarter due to the outlook (markets are forward-looking), but the realized numbers seem to be sending shares higher. The stock traded up 2.6% to $41 immediately following the results.
Big picture, is QuidelOrtho a buy here and now? If you’re making that decision, you should consider the bigger picture of valuation, business qualities, as well as the latest earnings. We cover that in our actionable full research report which you can read here, it’s free.