Commercial rental vehicle and delivery company Ryder (NYSE: R) fell short of the market’s revenue expectations in Q3 CY2025, with sales flat year on year at $3.17 billion. Its GAAP profit of $3.33 per share was 1.5% below analysts’ consensus estimates.
Is now the time to buy Ryder? Find out by accessing our full research report, it’s free for active Edge members.
Ryder (R) Q3 CY2025 Highlights:
- Revenue: $3.17 billion vs analyst estimates of $3.19 billion (flat year on year, 0.7% miss)
- EPS (GAAP): $3.33 vs analyst expectations of $3.38 (1.5% miss)
- Adjusted EBITDA: $742 million vs analyst estimates of $728.8 million (23.4% margin, 1.8% beat)
- Operating Margin: 9%, in line with the same quarter last year
- Market Capitalization: $7.46 billion
Company Overview
As one of the first companies to introduce the idea of leasing trucks, Ryder (NYSE: R) provides rental vehicles to businesses and delivers packages directly to homes or businesses.
Revenue Growth
A company’s long-term sales performance is one signal of its overall quality. Even a bad business can shine for one or two quarters, but a top-tier one grows for years. Over the last five years, Ryder grew its sales at a decent 8.4% compounded annual growth rate. Its growth was slightly above the average industrials company and shows its offerings resonate with customers.
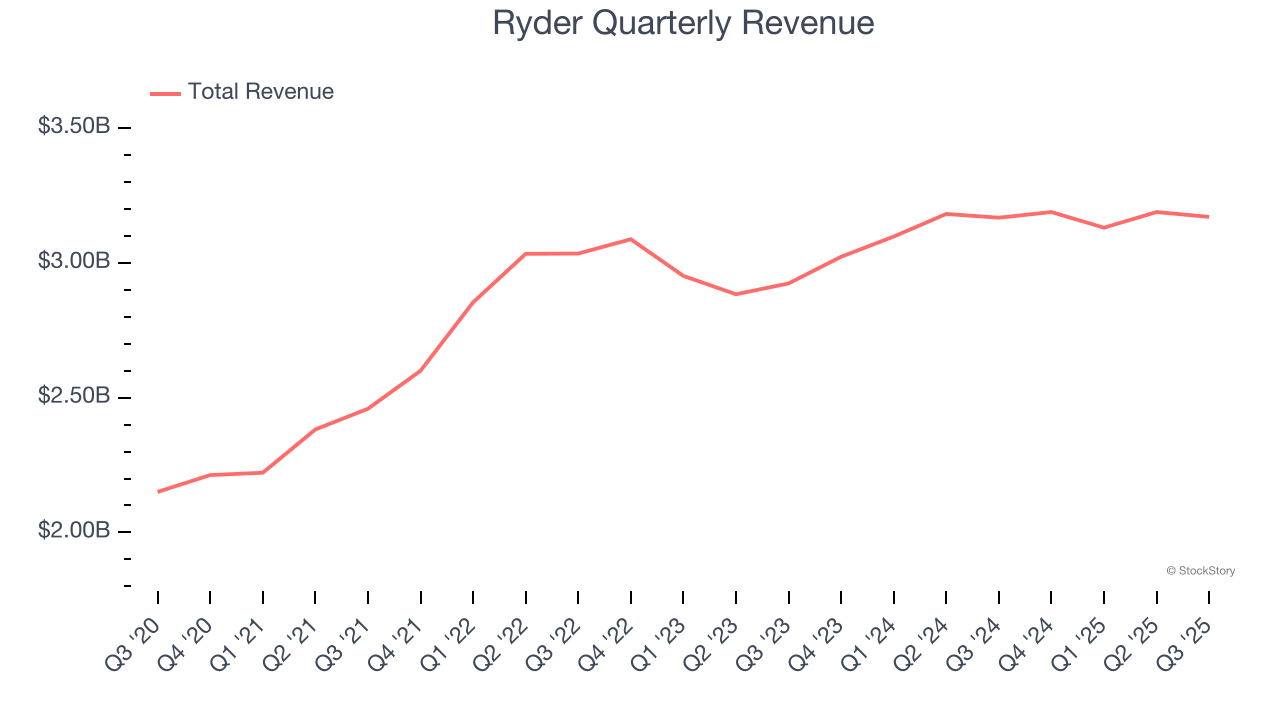
Long-term growth is the most important, but within industrials, a half-decade historical view may miss new industry trends or demand cycles. Ryder’s recent performance shows its demand has slowed as its annualized revenue growth of 3.5% over the last two years was below its five-year trend. We also note many other Ground Transportation businesses have faced declining sales because of cyclical headwinds. While Ryder grew slower than we’d like, it did do better than its peers. 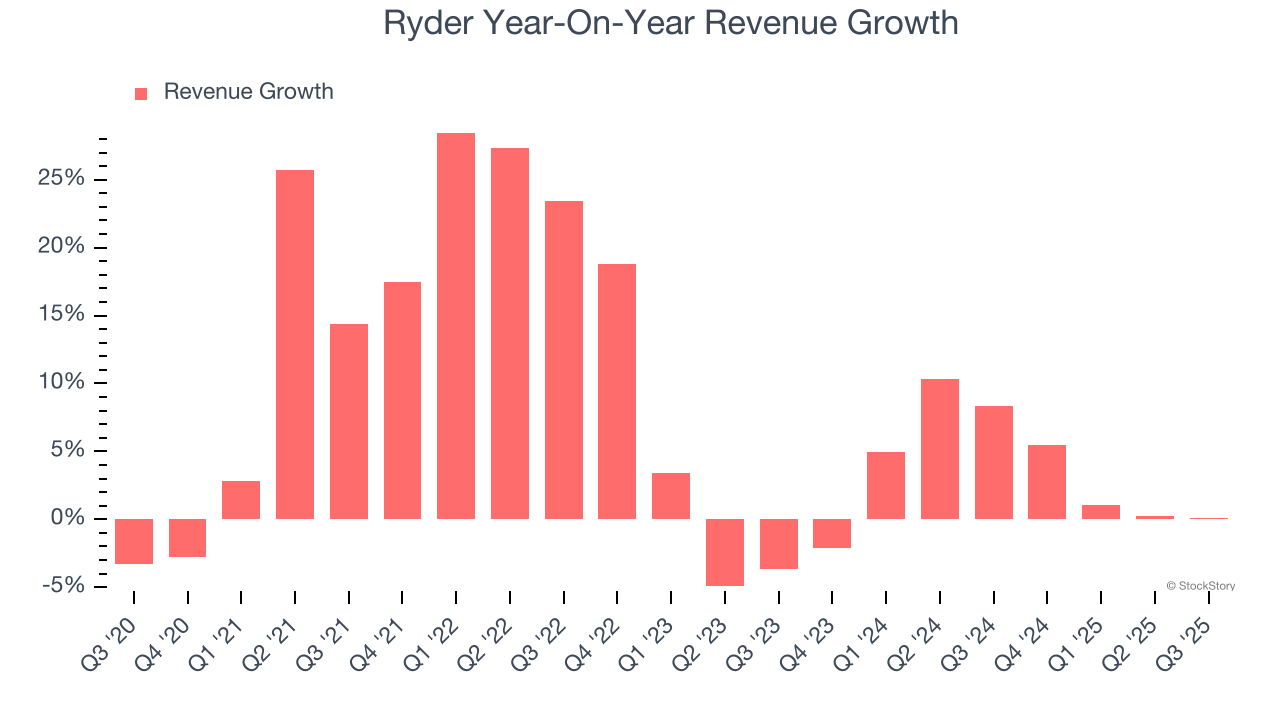
We can better understand the company’s revenue dynamics by analyzing its most important segments, Fleet Management Solutions and Supply Chain Solutions, which are 46.2% and 43.5% of revenue. Over the last two years, Ryder’s Fleet Management Solutions revenue (leasing and rental) averaged 1.4% year-on-year declines. On the other hand, its Supply Chain Solutions revenue ( designing and managing customers' distribution) averaged 6% growth. 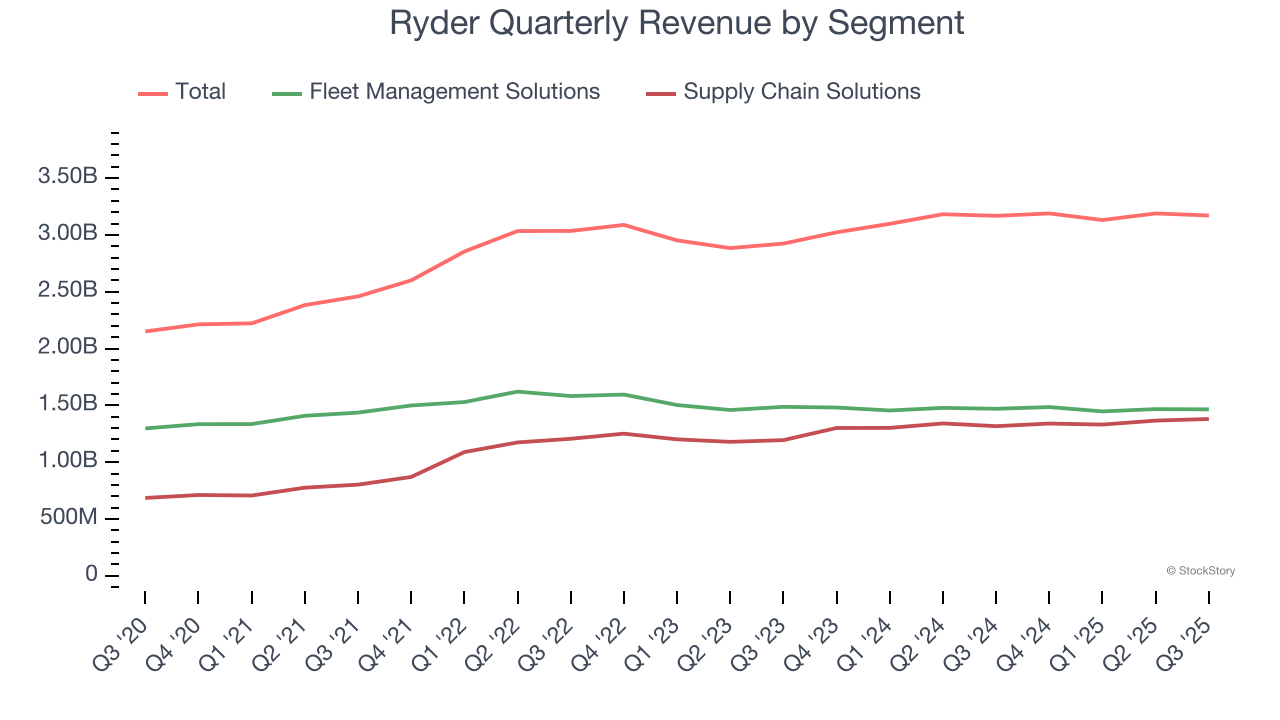
This quarter, Ryder’s $3.17 billion of revenue was flat year on year, falling short of Wall Street’s estimates.
Looking ahead, sell-side analysts expect revenue to grow 2.3% over the next 12 months, similar to its two-year rate. This projection doesn't excite us and implies its products and services will face some demand challenges.
Today’s young investors won’t have read the timeless lessons in Gorilla Game: Picking Winners In High Technology because it was written more than 20 years ago when Microsoft and Apple were first establishing their supremacy. But if we apply the same principles, then enterprise software stocks leveraging their own generative AI capabilities may well be the Gorillas of the future. So, in that spirit, we are excited to present our Special Free Report on a profitable, fast-growing enterprise software stock that is already riding the automation wave and looking to catch the generative AI next.
Operating Margin
Ryder was profitable over the last five years but held back by its large cost base. Its average operating margin of 7.8% was weak for an industrials business. This result isn’t too surprising given its low gross margin as a starting point.
On the plus side, Ryder’s operating margin rose by 2.7 percentage points over the last five years, as its sales growth gave it operating leverage. We’ll take Ryder’s improvement as many Ground Transportation companies saw their margins fall (along with revenue, as mentioned above) because the cycle turned in the wrong direction.
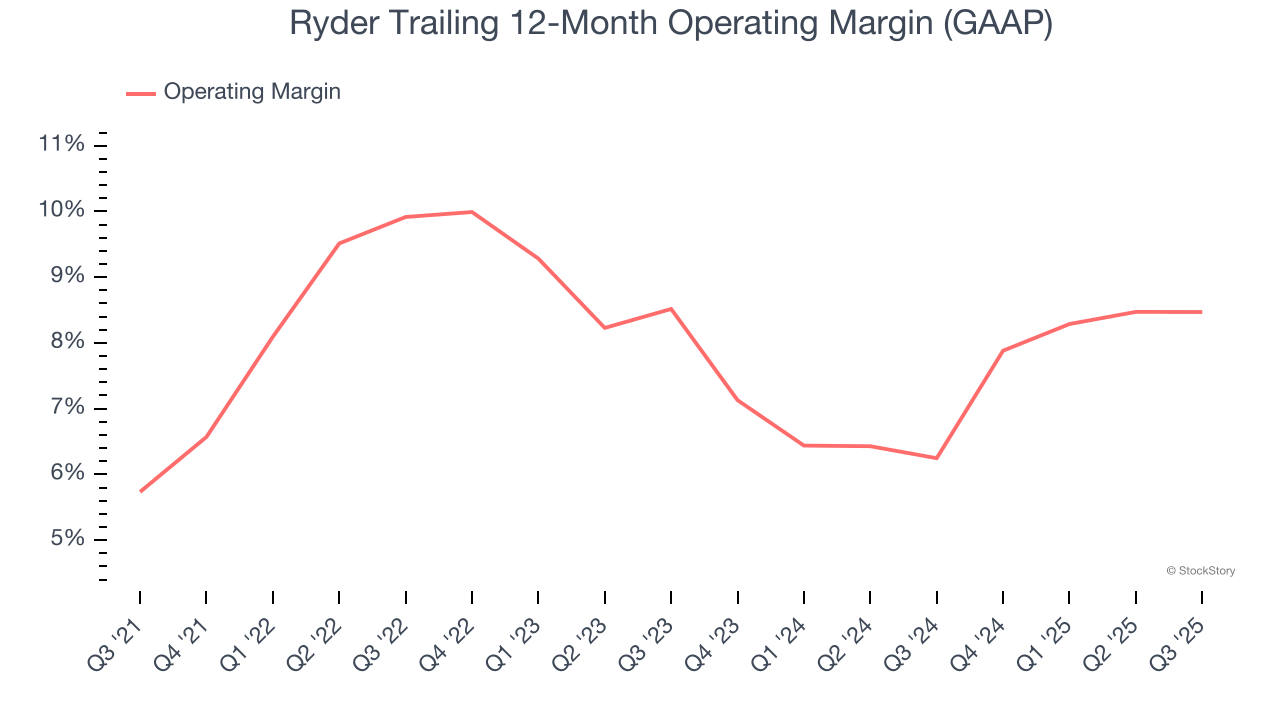
In Q3, Ryder generated an operating margin profit margin of 9%, in line with the same quarter last year. This indicates the company’s cost structure has recently been stable.
Earnings Per Share
We track the long-term change in earnings per share (EPS) for the same reason as long-term revenue growth. Compared to revenue, however, EPS highlights whether a company’s growth is profitable.
Ryder’s full-year EPS flipped from negative to positive over the last five years. This is encouraging and shows it’s at a critical moment in its life.
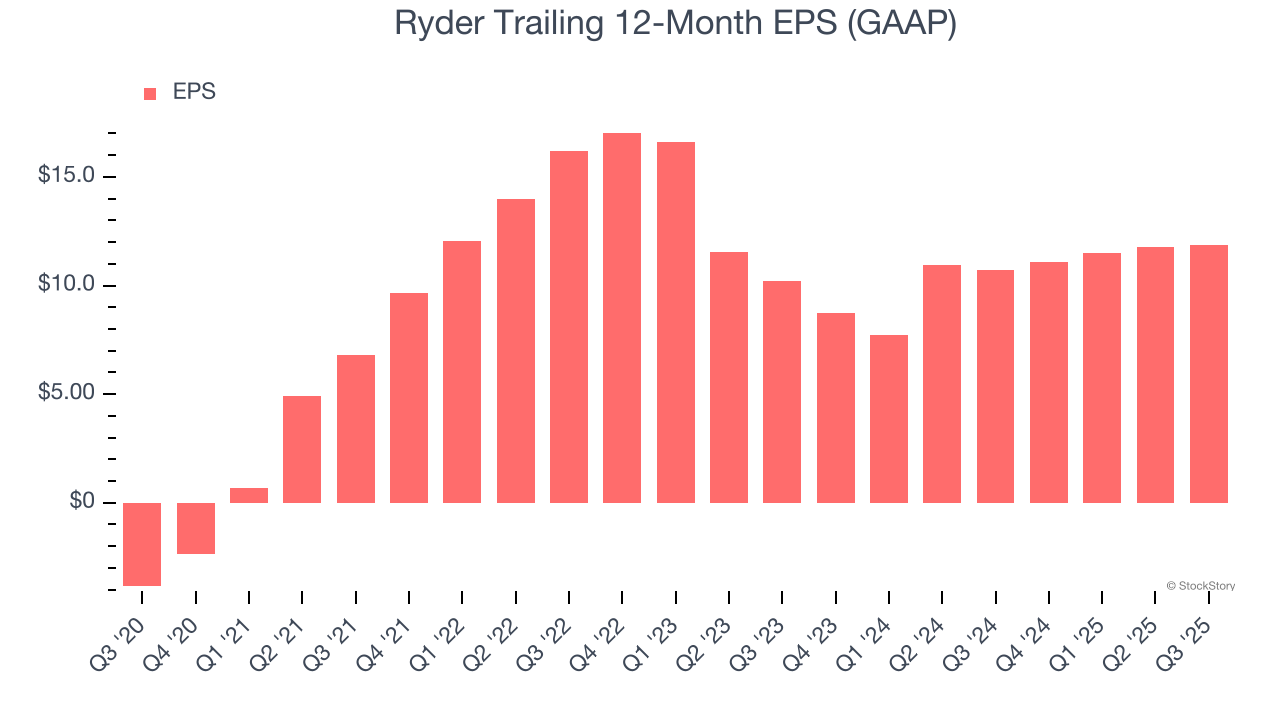
Like with revenue, we analyze EPS over a shorter period to see if we are missing a change in the business.
Ryder’s EPS grew at an unimpressive 7.9% compounded annual growth rate over the last two years. On the bright side, this performance was higher than its 3.5% annualized revenue growth and tells us the company became more profitable on a per-share basis as it expanded.
Diving into the nuances of Ryder’s earnings can give us a better understanding of its performance. A two-year view shows that Ryder has repurchased its stock, shrinking its share count by 10.1%. This tells us its EPS outperformed its revenue not because of increased operational efficiency but financial engineering, as buybacks boost per share earnings. 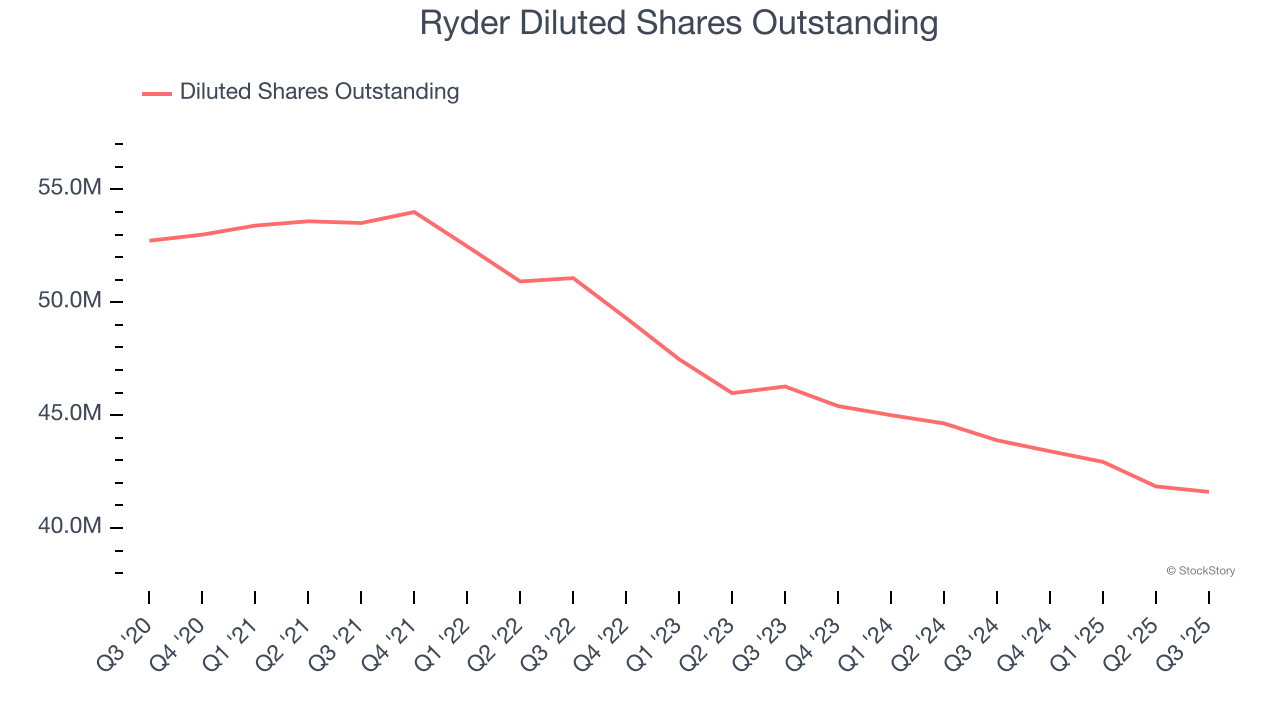
In Q3, Ryder reported EPS of $3.33, up from $3.23 in the same quarter last year. Despite growing year on year, this print slightly missed analysts’ estimates, but we care more about long-term EPS growth than short-term movements. We also like to analyze expected EPS growth based on Wall Street analysts’ consensus projections, but there is insufficient data.
Key Takeaways from Ryder’s Q3 Results
It was encouraging to see Ryder beat analysts’ EBITDA expectations this quarter. On the other hand, its revenue slightly missed and its EPS fell a bit short of Wall Street’s estimates. Overall, this quarter could have been better. The stock remained flat at $183.20 immediately following the results.
Is Ryder an attractive investment opportunity right now? We think that the latest quarter is only one piece of the longer-term business quality puzzle. Quality, when combined with valuation, can help determine if the stock is a buy. We cover that in our actionable full research report which you can read here, it’s free for active Edge members.