

Global airline American Airlines (NASDAQ: AAL) met Wall Street’s revenue expectations in Q3 CY2025, but sales were flat year on year at $13.69 billion. Its non-GAAP loss of $0.17 per share was 38.2% above analysts’ consensus estimates.
Is now the time to buy American Airlines? Find out by accessing our full research report, it’s free for active Edge members.
American Airlines (AAL) Q3 CY2025 Highlights:
- Revenue: $13.69 billion vs analyst estimates of $13.63 billion (flat year on year, in line)
- Adjusted EPS: -$0.17 vs analyst estimates of -$0.28 (38.2% beat)
- Management raised its full-year Adjusted EPS guidance to $0.80 at the midpoint, a 60% increase
- Operating Margin: 1.1%, in line with the same quarter last year
- Free Cash Flow was -$872 million compared to -$191 million in the same quarter last year
- Revenue Passenger Miles: 66.58 billion, up 1.08 billion year on year
- Market Capitalization: $7.98 billion
“The American Airlines team is delivering on our commitments,” said American’s CEO Robert Isom.
Company Overview
One of the ‘Big Four’ airlines in the US, American Airlines (NASDAQ: AAL) is a major global air carrier that serves both business and leisure travelers through its domestic and international flights.
Revenue Growth
A company’s long-term sales performance is one signal of its overall quality. Any business can experience short-term success, but top-performing ones enjoy sustained growth for years. Luckily, American Airlines’s sales grew at a decent 17.1% compounded annual growth rate over the last five years. Its growth was slightly above the average consumer discretionary company and shows its offerings resonate with customers.
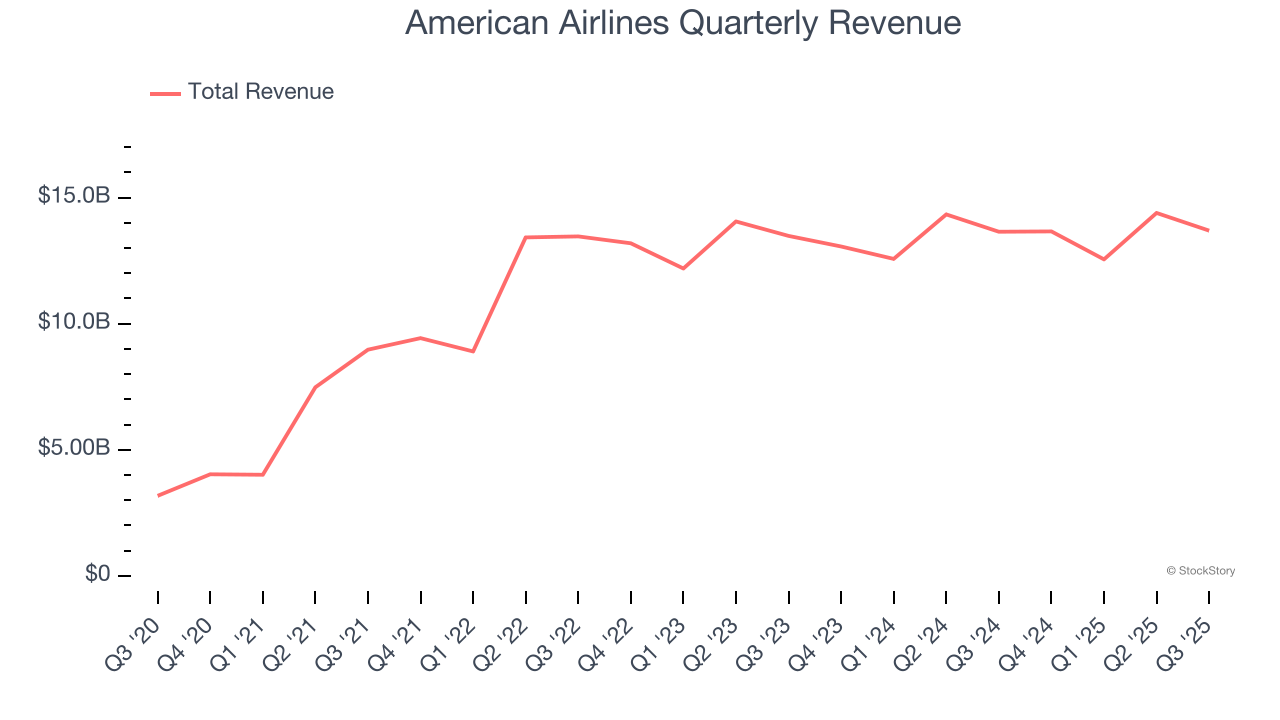
We at StockStory place the most emphasis on long-term growth, but within consumer discretionary, a stretched historical view may miss a company riding a successful new property or trend. American Airlines’s recent performance shows its demand has slowed as its annualized revenue growth of 1.3% over the last two years was below its five-year trend. 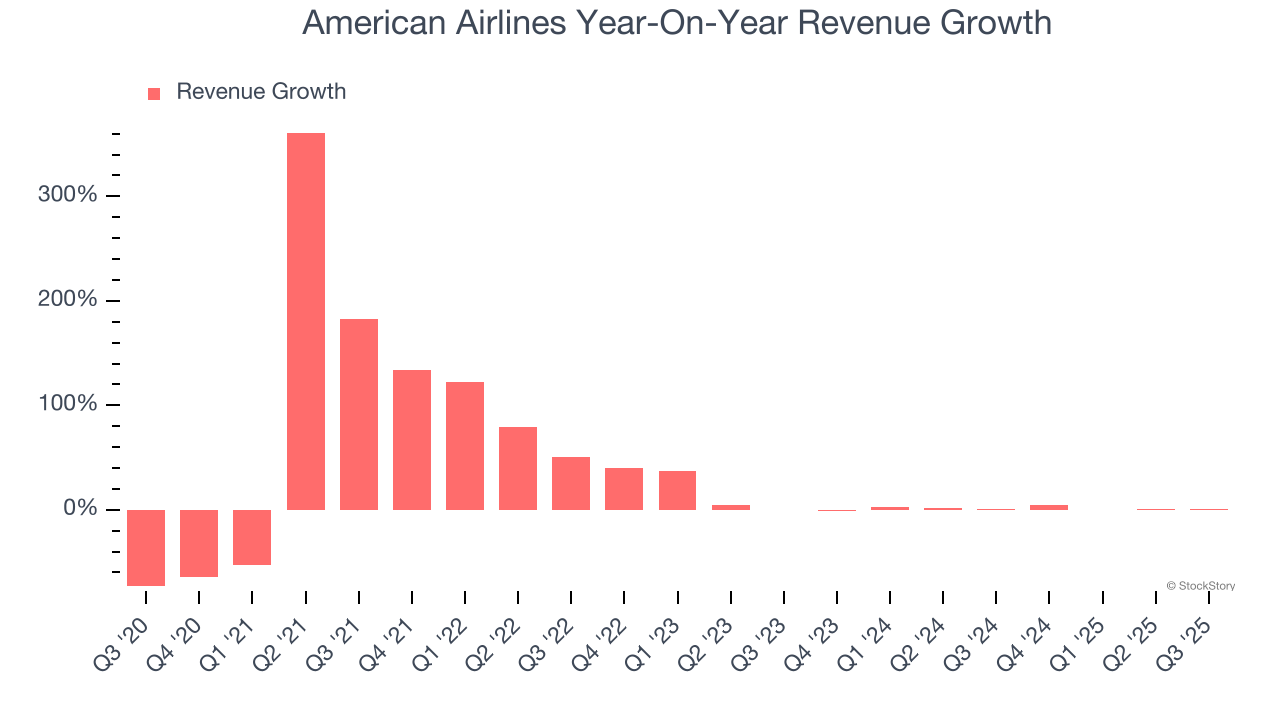
We can dig further into the company’s revenue dynamics by analyzing its number of revenue passenger miles, which reached 66.58 billion in the latest quarter. Over the last two years, American Airlines’s revenue passenger miles averaged 4.4% year-on-year growth. Because this number is higher than its revenue growth during the same period, we can see the company’s monetization has fallen. 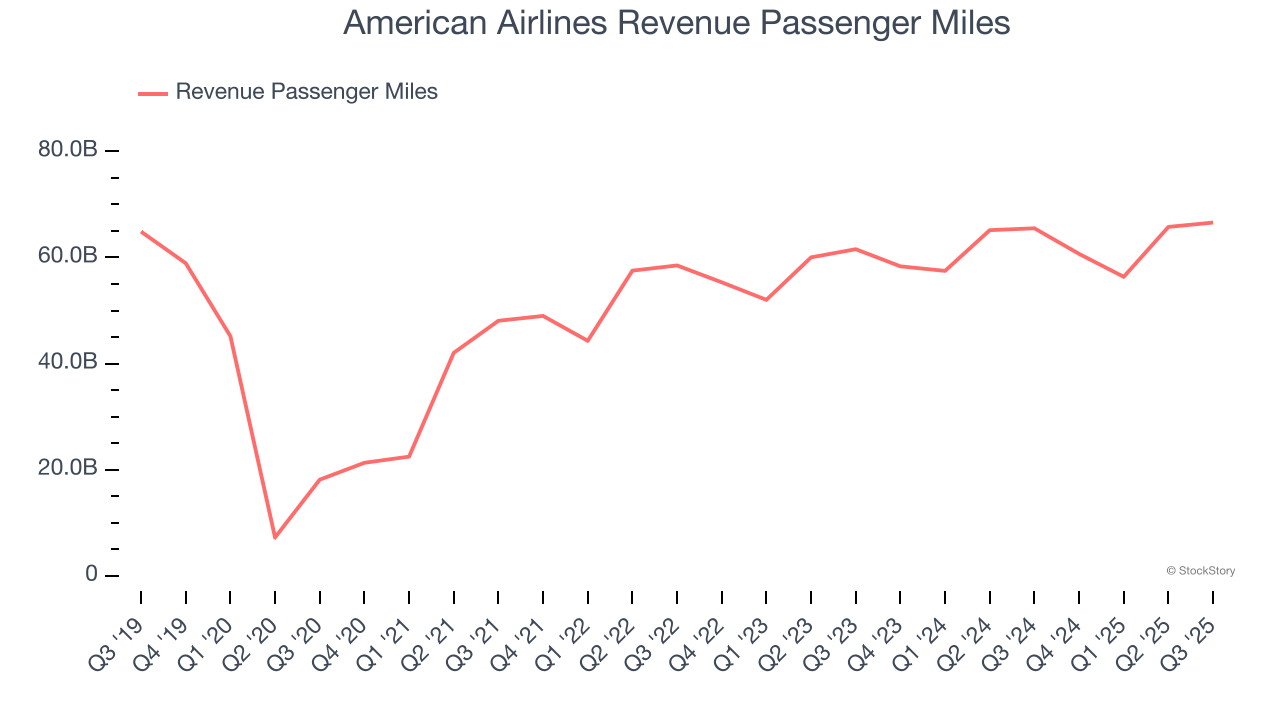
This quarter, American Airlines’s $13.69 billion of revenue was flat year on year and in line with Wall Street’s estimates.
Looking ahead, sell-side analysts expect revenue to grow 5.3% over the next 12 months. Although this projection implies its newer products and services will spur better top-line performance, it is still below average for the sector.
Software is eating the world and there is virtually no industry left that has been untouched by it. That drives increasing demand for tools helping software developers do their jobs, whether it be monitoring critical cloud infrastructure, integrating audio and video functionality, or ensuring smooth content streaming. Click here to access a free report on our 3 favorite stocks to play this generational megatrend.
Operating Margin
Operating margin is an important measure of profitability as it shows the portion of revenue left after accounting for all core expenses – everything from the cost of goods sold to advertising and wages. It’s also useful for comparing profitability across companies with different levels of debt and tax rates because it excludes interest and taxes.
American Airlines’s operating margin might fluctuated slightly over the last 12 months but has remained more or less the same, averaging 4% over the last two years. This profitability was lousy for a consumer discretionary business and caused by its suboptimal cost structure.
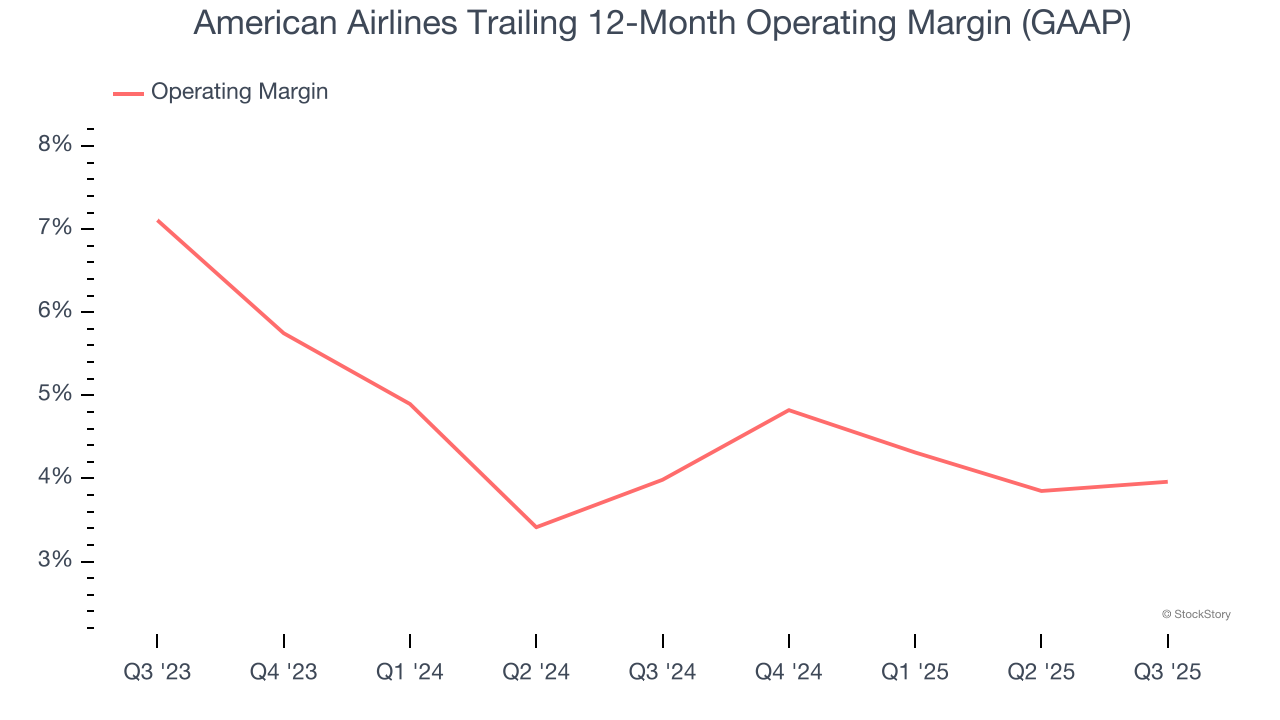
This quarter, American Airlines generated an operating margin profit margin of 1.1%, in line with the same quarter last year. This indicates the company’s overall cost structure has been relatively stable.
In the coming year, Wall Street expects American Airlines to maintain its trailing 12-month operating margin of 4%.
Earnings Per Share
We track the long-term change in earnings per share (EPS) for the same reason as long-term revenue growth. Compared to revenue, however, EPS highlights whether a company’s growth is profitable.
American Airlines’s full-year EPS flipped from negative to positive over the last five years. This is encouraging and shows it’s at a critical moment in its life.
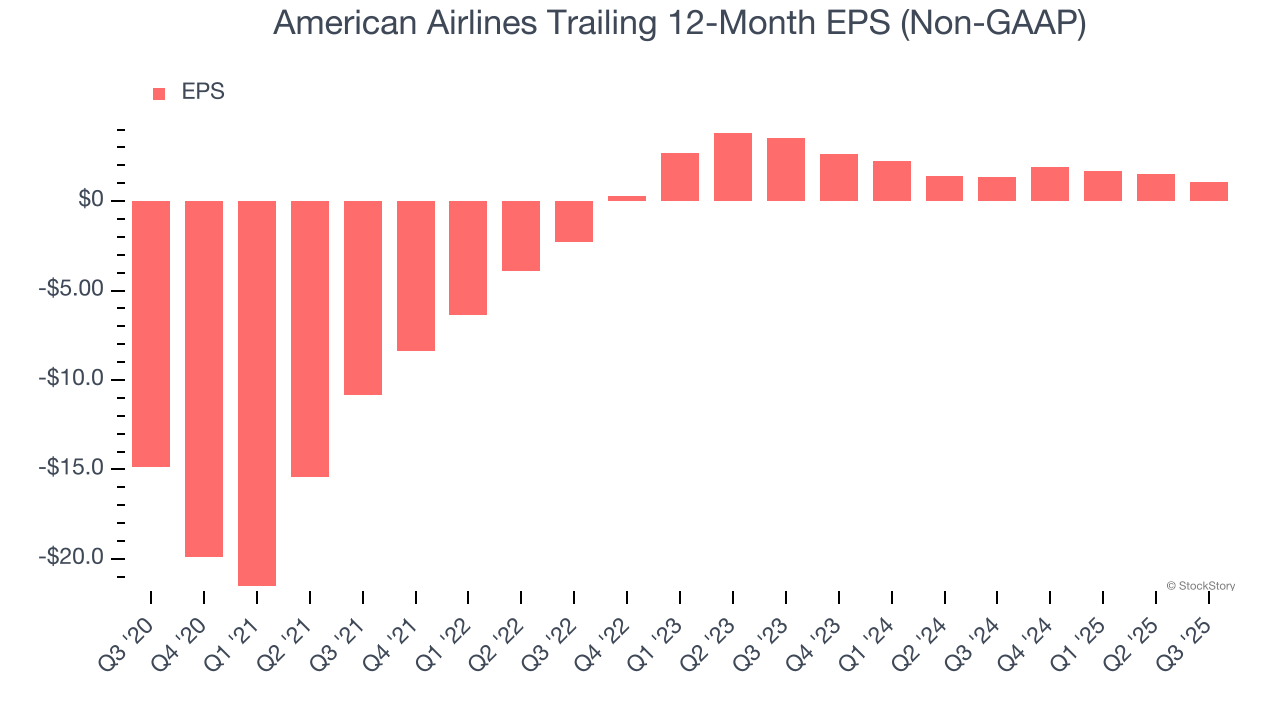
In Q3, American Airlines reported adjusted EPS of negative $0.17, down from $0.30 in the same quarter last year. Despite falling year on year, this print easily cleared analysts’ estimates. Over the next 12 months, Wall Street expects American Airlines’s full-year EPS of $1.05 to grow 38.3%.
Key Takeaways from American Airlines’s Q3 Results
We were impressed by American Airlines’s optimistic EPS guidance for next quarter, which blew past analysts’ expectations. We were also glad its EPS outperformed Wall Street’s estimates. Overall, we think this was a solid quarter with some key areas of upside. The stock traded up 3.4% to $12.48 immediately after reporting.
Sure, American Airlines had a solid quarter, but if we look at the bigger picture, is this stock a buy? The latest quarter does matter, but not nearly as much as longer-term fundamentals and valuation, when deciding if the stock is a buy. We cover that in our actionable full research report which you can read here, it’s free for active Edge members.


