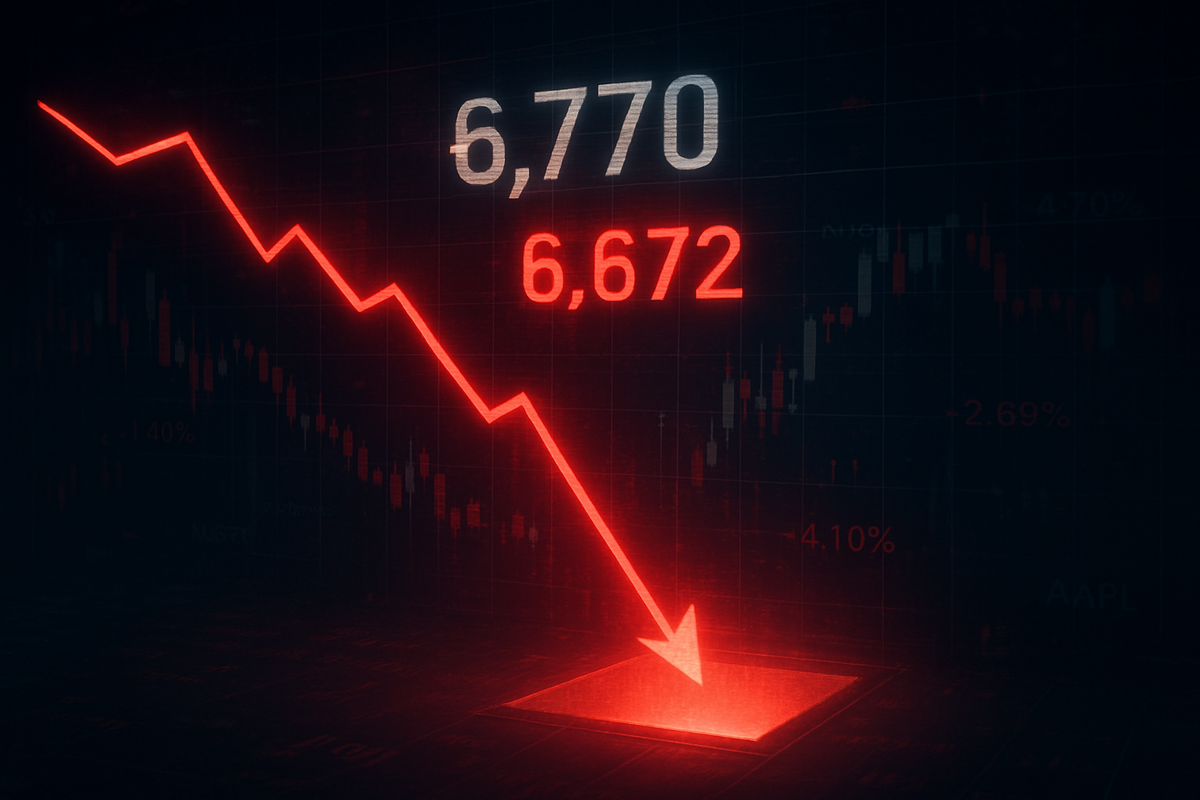
The long-feared "trapdoor" in the equity markets has finally swung open. On March 13, 2026, the S&P 500 (^GSPC) decisively broke below the critical 6,770 support level, closing at 6,672 and signaling a definitive end to the speculative fervor that had pushed the index to record highs earlier this year. This breach follows a brutal week of trading that saw over $1.3 trillion in market capitalization evaporated, primarily from the technology and artificial intelligence sectors, as investors grapple with a toxic cocktail of geopolitical instability and "AI fatigue."
The immediate implications are stark: market momentum has shifted from "buy the dip" to "sell the rip." By piercing the 6,770 momentum pivot—a level that had held firm through several volatility spikes in late 2025—the index has entered a technical "no man’s land." With the 100-day and 20-week moving averages now functioning as overhead resistance rather than support, technical analysts are warning that the path of least resistance is now downward, with the next major psychological floor sitting at the 6,500 mark.
A Perfect Storm: From All-Time Highs to Technical Turmoil
The descent into the current correction began shortly after the S&P 500 hit an all-time high of 7,002 in late January 2026. The initial cracks appeared in early March when a "Monday Selloff" on March 9th wiped nearly $900 billion from the markets in a single session. This panic was triggered by an "Iran Shock"—reports of missile strikes on commercial tankers in the Persian Gulf. As Brent crude oil prices surged to $120 per barrel, the market's hope for a "soft landing" evaporated, replaced by the grim specter of stagflation.
The timeline of the breakdown accelerated as the Federal Reserve, led by Chairman Jerome Powell, signaled that interest rates would remain restrictive at 3.5%–3.75%. The Fed’s refusal to pivot was driven by the lingering inflationary effects of the Universal 15% Tariffs enacted in late 2025, which have kept consumer prices "sticky" despite slowing growth. When the index failed to reclaim the 6,850 level (the 50-day SMA) on March 11, the technical damage became irreversible, leading to the high-volume break below 6,770 on March 12 and 13.
Institutional players have been the primary drivers of this exodus. High-frequency trading algorithms and systematic trend-following funds were triggered as the 6,770 level gave way, leading to a cascade of automated sell orders. Unlike previous corrections in 2024 and 2025, which were met with aggressive retail buying, the current environment is characterized by "buyer exhaustion." Investors who spent the last two years chasing the AI "gold rush" are now facing a reality check as capital expenditure (CapEx) costs begin to outweigh immediate revenue gains.
The Magnitude of the Wipeout: Winners and Losers
The brunt of the $1 trillion wipeout has been felt by the heavyweights of the "Magnificent Seven," which now account for nearly 45% of the S&P 500’s total weight. Microsoft (NASDAQ: MSFT) has emerged as a primary victim of this valuation compression. Despite its dominance in cloud computing, the company’s stock plunged nearly 20% from its 52-week highs as investors grew weary of "margin-destroying" AI spending. By mid-February, Microsoft had already seen over $600 billion in market value vanish, a trend that accelerated during this week's technical breakdown.
Nvidia (NASDAQ: NVDA), the once-unassailable poster child of the AI revolution, has also seen its armor pierced. While the company reported a staggering $68 billion in quarterly revenue in February, the stock failed to maintain its upward trajectory. As the S&P 500 broke 6,770, Nvidia fell below the $200 psychological floor, as the market began to price in an inevitable slowdown in hardware orders from hyperscalers. Apple (NASDAQ: AAPL), which had been a defensive bastion due to its massive cash reserves, finally succumbed to the selling pressure this week, losing over $250 billion in market cap as institutional funds liquidated liquid assets to cover losses elsewhere.
Conversely, the "winners" in this environment are few and far between, primarily located in defensive sectors. Energy giants like ExxonMobil (NYSE: XOM) have seen a tactical inflow as oil prices remain elevated, though even these gains are capped by fears of a broader economic slowdown. Gold and short-term Treasuries have also seen a resurgence in demand, with investors treating cash as a strategic "optionality" asset for the first time in years. The shift represents a massive rotation out of growth and into preservation, a move that typically precedes a protracted market bottom.
Wider Significance: AI Fatigue and the New Regulatory Reality
This event marks a significant turning point in the post-pandemic market cycle, drawing uncomfortable parallels to the Dot-com bubble burst of 2000. The primary difference today is the concentration of power; because the S&P 500 is so top-heavy, a correction in just three or four tech names can drag the entire index into a bear market. The breach of 6,770 suggests that the "AI premium" is being stripped away as shareholders demand more than just "growth potential"—they are now demanding profitability and sustainable margins.
Furthermore, the impact of the 2025 Universal Tariffs cannot be overstated. By adding a 15% floor to the cost of imported components, the policy has effectively squeezed the margins of hardware manufacturers and retailers alike. This has created a "policy ceiling" for the market; while the Fed would traditionally cut rates to stimulate a flagging market, the tariff-induced inflation has tied their hands. This policy paralysis is a new variable for 2026 investors, making the current technical breakdown more significant than those of the previous decade.
The ripple effects are already being felt across the Atlantic and Pacific. European and Asian markets have followed the S&P 500’s lead, as global supply chains remain sensitive to the volatility in the Persian Gulf. Historically, when the S&P 500 breaks its 100-day moving average with such high volume, it takes an average of four to six months for the index to establish a durable floor. This suggests that the current volatility is not a "one-off" event but the start of a multi-month re-pricing of risk assets globally.
Looking Ahead: The Path to 6,500
In the short term, the market is looking "oversold" on several technical indicators, including the Relative Strength Index (RSI), which has dipped into the low 20s. A "dead cat bounce" back toward the 6,770-resistance level is possible in the coming days, but without a significant de-escalation in the Middle East or a dovish shift from the Fed, such rallies are likely to be sold. Strategists are now focusing on the 200-day Simple Moving Average (SMA), which currently sits near 6,500, as the ultimate destination for this correction.
Long-term, this wipeout may provide a necessary "reset" for the technology sector. The extreme valuations seen in late 2025 were unsustainable, and a move toward the 6,500 level would bring the S&P 500 back in line with historical price-to-earnings (P/E) ratios. Companies that can demonstrate AI-driven cost savings and revenue growth during this downturn will likely emerge as the new leaders of the next cycle. However, the path to that recovery will require strategic pivots, with a focus on efficiency and cash flow rather than "growth at any cost."
Market Wrap-Up and Investor Outlook
The S&P 500’s break below 6,770 is a watershed moment for the 2026 market, signifying a shift from speculative expansion to disciplined contraction. The $1.3 trillion wipeout in tech underscores the fragility of a market built on high-growth expectations during a period of rising energy costs and restrictive monetary policy. For investors, the takeaway is clear: the "buy every dip" strategy that dominated the last two years has been rendered obsolete by new macroeconomic and technical realities.
Moving forward, the market will remain hyper-sensitive to energy prices and Fed rhetoric. If the index fails to stabilize near 6,600, the probability of a deeper "bear market" decline toward 6,000 increases significantly. Investors should watch for a stabilization in the "Magnificent Seven" stocks and a cooling of the oil market as the primary signals for a potential bottom. Until then, caution remains the order of the day as the market continues its painful search for a new equilibrium in a post-AI-hype world.
This content is intended for informational purposes only and is not financial advice.