
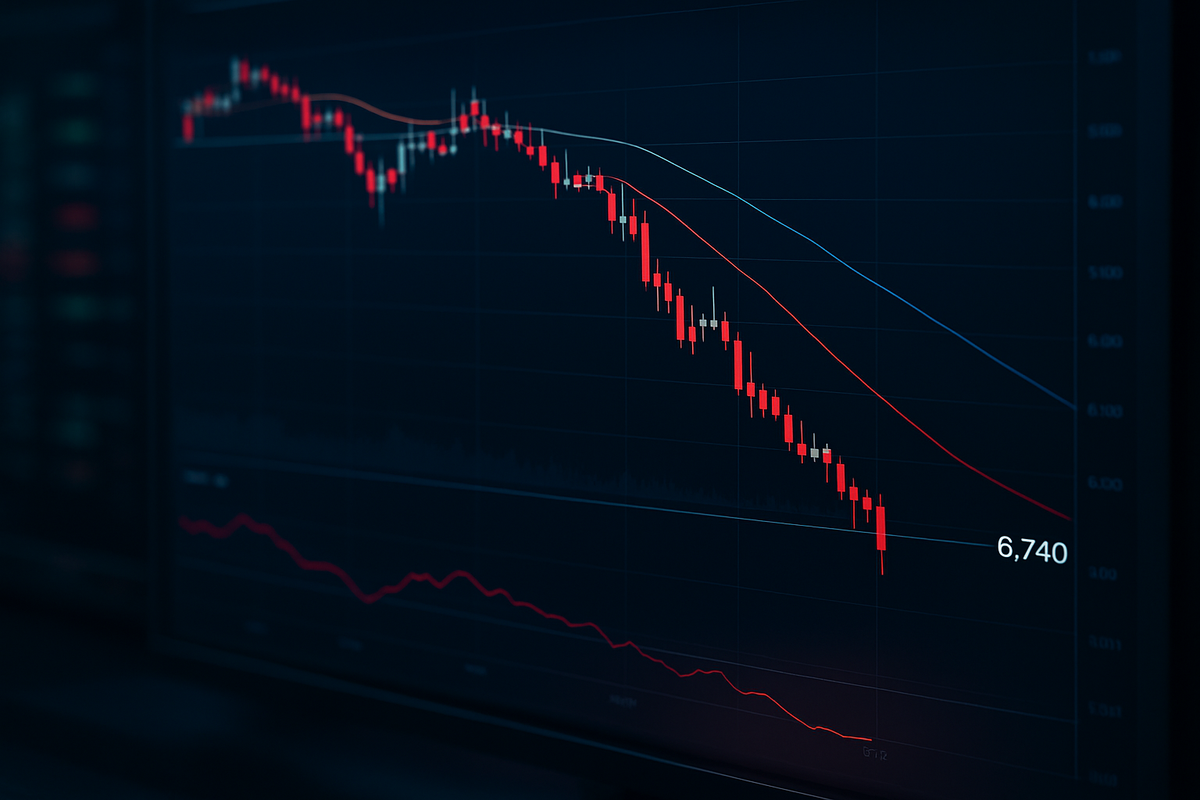
The S&P 500 (INDEXSP: .INX) plummeted to a closing level of 6,740 on March 12, 2026, marking its lowest point since mid-December and signaling a potentially grueling shift in market regime. This decline represents a decisive breach of both the 50-day and 100-day moving averages, technical levels that have served as the "floor" for the bull market throughout much of 2025. The dual-layered breakdown has effectively evaporated the "buy the dip" sentiment that sustained equity valuations during the early winter months, as investors grapple with a combination of deteriorating macroeconomic data and shifting institutional sentiment.
For traders and algorithmic systems, the drop below 6,740 is more than just a number; it is a "trapdoor event." By slicing through the 100-day moving average on high volume, the index has entered a technical vacuum with little historical support until the 200-day moving average, currently hovering near 6,582. This breakdown in short-term and intermediate-term momentum suggests that the path of least resistance for the broad market is now skewed to the downside, leaving the rally of the past year in serious jeopardy.
The Technical Anatomy of the Breakdown
The descent to 6,740 was not a sudden flash crash but a calculated "slow-motion" distribution by institutional players. The trouble began in late February when the S&P 500 first dipped below its 50-day moving average of 6,838. While bulls initially attempted to defend this level, a disappointing February payrolls report—revealing a shocking loss of 92,000 jobs—acted as a catalyst for a deeper sell-off. By March 5, the index had breached its 100-day moving average of 6,835, turning what was once a support zone into a formidable ceiling of resistance.
Market analysts have identified this period as a transition from a "liquidity-driven" market to a "fundamental-risk" market. Key stakeholders, including large pension funds and hedge funds, have reportedly been de-risking their portfolios in response to what some are calling the "Iran Shock"—a series of geopolitical escalations that have sent energy prices ticking higher. As the index hit its multi-month low today, algorithmic trading platforms triggered a cascade of sell orders, further accelerating the decline as the Relative Strength Index (RSI) dropped below the critical 40 level, a traditional signal of bearish trend confirmation.
The Heavy Anchors: Winners and Losers
In this technical breakdown, the former leaders of the market have become its heaviest anchors. Nvidia (NASDAQ: NVDA), the crown jewel of the artificial intelligence boom, has seen its behavior shift from a growth engine to a source of extreme volatility. After failing to hold its own 50-day moving average, NVDA plummeted into the $170–$175 range. Given its massive weighting in the S&P 500, NVDA’s 15% slide from its February highs has been a primary contributor to the index’s inability to find a bottom, mathematically shaving significant points off the benchmark with every percentage point it loses.
Similarly, Microsoft (NASDAQ: MSFT) has struggled to maintain its leadership position. Trading below its 50-day and 200-day moving averages, MSFT is currently stuck in a rangebound state that reflects growing investor fatigue regarding massive capital expenditures in AI. Apple (NASDAQ: AAPL) also remains under pressure, as multiple analyst downgrades and a shift in consumer focus have left the stock stagnant. While defensive sectors like Utilities and Consumer Staples typically "win" by losing less during such corrections, the sheer weight of these mega-cap tech giants has ensured that very few corners of the market remained unscathed during this breach of 6,740.
A Regime Shift in Broader Industry Trends
The current technical breakdown fits into a larger pattern of "mean reversion" after the historic gains of 2025. Historically, when the S&P 500 breaches its 100-day moving average after a prolonged rally, it often precedes a 10% to 15% correction as the market searches for a sustainable floor. This event mirrors the technical struggles seen in 2022 and late 2024, where breaching the mid-term averages signaled a multi-month period of consolidation and heightened volatility.
The ripple effects are already being felt across the financial landscape. Competitors in the brokerage and fintech space are seeing a surge in "short" activity, while volatility-linked products are experiencing their highest demand in over a year. From a regulatory standpoint, the rapid-fire algorithmic selling seen at the 6,835 level may once again bring the role of high-frequency trading under the microscope of the SEC, especially if the "trapdoor" leads to a disorderly decline toward the 200-day average.
What Lies Ahead: The Road to 6,582
In the short term, the market is looking for any signs of stabilization, but technical analysts warn that "oversold" does not mean "bottomed." The immediate outlook depends on whether the S&P 500 can reclaim the 6,800 level, which now acts as a massive wall of overhead supply. If the index fails to stage a relief rally within the next few trading sessions, a test of the 200-day moving average at 6,582 appears inevitable. This would represent a roughly 2.3% further decline from current levels and would be the ultimate "line in the sand" for the long-term bull market.
Strategic pivots are already underway. Many asset managers are shifting toward "capital preservation" modes, increasing cash positions or moving into short-dated Treasuries as they wait for the technical dust to settle. However, for long-term investors, this breakdown may eventually present a significant opportunity. Historically, corrections that retest the 200-day moving average have served as healthy resets that flush out "weak hands" and set the stage for the next leg of a secular bull market—provided the macroeconomic backdrop doesn't deteriorate into a full-scale recession.
Navigating the New Market Reality
The closing of the S&P 500 at 6,740 serves as a stark reminder that even the strongest bull markets require technical breathers. The breach of the 50 and 100-day moving averages marks a definitive end to the low-volatility environment that characterized the end of 2025. Investors should now shift their focus from "chasing growth" to "evaluating support," as the market attempts to find its footing in a landscape defined by higher geopolitical risks and softening employment data.
Moving forward, the 200-day moving average will be the most critical level to watch. A successful defense of that level could signal a mid-year recovery, while a break below it would officially move the market into a "bear regime." For the coming months, the mantra for investors will likely be caution over conviction, as the technical "trapdoor" remains open and the market searches for a new equilibrium.
This content is intended for informational purposes only and is not financial advice.


