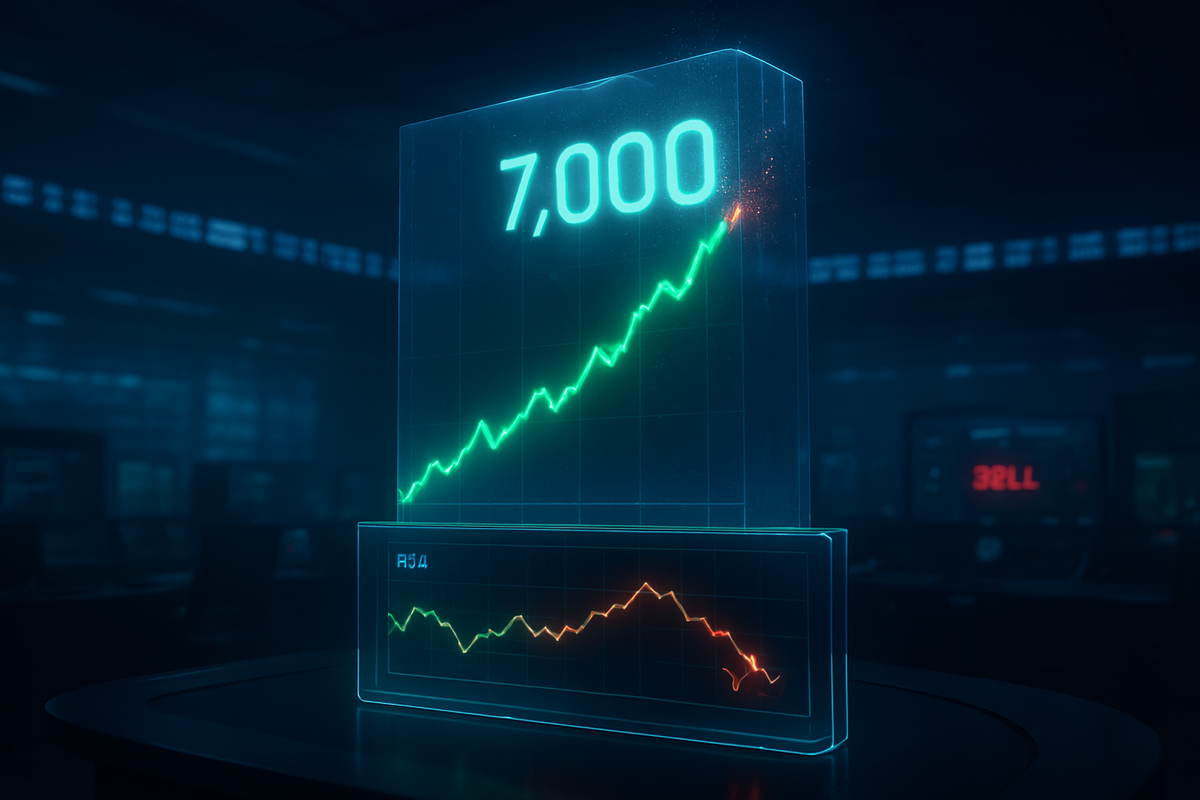
The SPDR S&P 500 ETF Trust (NYSEARCA:SPY) and the broader market reached a historic, yet fleeting, milestone last week as the S&P 500 index briefly eclipsed the 7,000-point mark for the first time in history. However, the euphoria of the "7K" era has been short-lived. Since touching an intraday high of 7,002 on January 28, 2026, the index has retreated to approximately 6,939, signaling that the psychological barrier is acting more like a "gamma ceiling" than a floor. Market participants are now grappling with a visible loss of momentum that suggests the relentless bull run of the past two years may be entering a period of exhaustion.
This retreat is not merely a random fluctuation; it is accompanied by a glaring bearish divergence in the Relative Strength Index (RSI). While the price of the S&P 500 pushed to record highs, the RSI failed to follow suit, peaking at a lower level than it did during the rallies of late 2025. This technical mismatch, often viewed as a precursor to a "momentum-reset" correction, indicates that the velocity of buying pressure is fading. As the market enters the first week of February, the divergence between the S&P 500 and the tech-heavy Invesco QQQ Trust (NASDAQ: QQQ) has further intensified concerns about the sustainability of this record-breaking ascent.
The 'Sisyphus Moment': A Timeline of the 7,000 Struggle
The journey to 7,000 was a rapid 16.6% climb from the 6,000-point milestone reached in November 2024. Throughout January 2026, institutional investors and retail traders alike watched as the index marched toward this "vanity plate" level. On January 28, the index finally breached the threshold, largely driven by optimism surrounding the "AI application phase," where broad corporate productivity gains began to show up in the earnings of the "other 493" companies. However, the breach triggered a massive wave of profit-taking. Traders who had used the 7,000 strike price for options positioning began to unwind their "long delta" hedges, creating a technical bottleneck that prevented the index from sustaining its gains.
Leading up to this retreat, the market hit a DeMARK "9" exhaustion count, a sophisticated technical signal that has preceded 10%+ corrections on three separate occasions over the last five years. As the index peaked, institutional de-risking became evident in the options market. The CBOE Volatility Index (VIX) climbed from a complacent 14.49 to over 17, even as the index hit new highs—a rare "bullish price, bearish volatility" divergence that typically suggests big players are quietly buying insurance (put options) to protect their gains.
The primary stakeholders in this drama are the mega-cap tech companies and the high-frequency trading (HFT) firms that dominate the 7,000 gamma strike. The failure to hold the level has created a "Sisyphus moment" for the market, where the effort required to push the index higher is increasing just as the fundamental tailwinds, such as expected interest rate cuts, are being re-priced due to a "sticky" 2.4% inflation rate.
Winners and Losers in a Momentum-Starved Market
In this environment of thinning breadth, the "winners" are becoming increasingly concentrated. Heavyweights like NVIDIA Corp. (NASDAQ: NVDA) and Microsoft Corp. (NASDAQ: MSFT) continue to attract capital as safe havens for growth, but their outsized influence is now a double-edged sword. With S&P 500 concentration reaching a record 42% in the top 10 stocks—surpassing the 1999 Dot-Com peak—the index remains buoyed by a few titans while the average stock suffers. Investors who shifted into the Invesco S&P 500 Equal Weight ETF (NYSEARCA:RSP) are finding themselves on the losing end of this divergence, as the equal-weighted version of the index has significantly lagged its market-cap-weighted counterpart.
Small-cap stocks, represented by the iShares Russell 2000 ETF (NYSEARCA:IWM), have also been hard hit by the retreat from 7,000. These companies are more sensitive to the "higher for longer" interest rate narrative that has resurfaced as the Fed hesitates to cut rates into a 7,000 S&P 500 environment. Conversely, defensive sectors such as consumer staples and utilities are beginning to see a "flight to safety" bid. Companies like Apple Inc. (NASDAQ: AAPL), which has seen its growth moderate but remains a cash-flow behemoth, are being treated as pseudo-bonds by investors looking to park capital away from the volatility of the AI hardware race.
Wider Significance and Historical Precedents
The current technical setup at 7,000 mirrors historical "Class A" bearish divergences seen in January 2020 and January 2022. In the 2022 instance, the S&P 500 moved just 1.5% above its previous high before collapsing into a year-long bear market. While the 2026 economy is structurally different—supported by a massive productivity boom from AI integration—the "Top-Heavy Jenga Tower" risk remains a potent threat. When the market is this concentrated, a single disappointing earnings report from a tech giant can trigger a cascading liquidation across the entire index.
Furthermore, the divergence between the S&P 500 and the Nasdaq is a classic signal of market thinning. Historically, when the Nasdaq fails to confirm new highs made by the S&P 500 (or vice versa), it suggests that the "rising tide" is no longer lifting all boats. This was most famously observed in the lead-up to the 2000 bubble burst and again during the late-2021 rotation from growth to value. The current trend suggests that we are moving from a conviction-led rally to an inertia-led rally, where the market continues higher simply because it has been going higher, rather than because of improving fundamentals.
What Comes Next: The 6,824 Support Test
In the short term, technical analysts are eyeing the 50-day Exponential Moving Average (EMA) at 6,824 as the first major line of defense. If the S&P 500 fails to find support at this level, the risk of a "momentum-reset" correction toward the 200-day moving average increases significantly. This would not necessarily mean the end of the bull market, but rather a healthy "clearing of the decks" to wash out speculative excess.
Longer-term, the market may require a "consolidation in time rather than price." This would involve the S&P 500 trading in a broad range between 6,700 and 7,000 for several months while earnings catch up to the lofty valuations. Investors should watch for a "convergence" where the RSI begins to make higher lows; until that happens, the risk remains skewed to the downside. Strategic pivots into quality-factor stocks and companies with high free-cash-flow yields may become the dominant trade of the second quarter of 2026.
Final Assessment for the Road Ahead
The retreat from 7,000 is a sobering reminder that even the most powerful bull markets must eventually contend with the laws of technical gravity. The combination of a major psychological milestone, a glaring RSI divergence, and record-high index concentration has created a "warning phase" for the market. While the "AI application phase" provides a strong fundamental backdrop, the technical "engine" of the market is clearly sputtering.
Moving forward, investors should watch for two key developments: first, whether the Nasdaq can regain its leadership and confirm the S&P 500's highs, and second, whether market breadth begins to expand. A healthy market requires more than just ten stocks to carry the weight of 500. For now, the 7,000 level remains a formidable wall, and the "loss of momentum" suggests that the path of least resistance may be sideways—or down—in the coming months.
This content is intended for informational purposes only and is not financial advice.