Enterprise cybersecurity firm SentinelOne Inc. (NYSE: S) stock took a (35%) drop on its fiscal Q1 2024 earnings release. As a hypergrowth company, it saw revenues spike more than 70% but lowered its fiscal full-year 2024 guidance causing investors to panic out of the stock. Profits continue to grow larger despite climbing revenues.
Unfortunately, the NYSE: S">cybersecurity company lowered its revenue guidance range for its fiscal full-year 2023. Its platform uses artificial intelligence (AI) toNASDAQ: DDOG"> monitor, predict and protect against real-time threats, including malware and file-based attacks. The company competes with other cybersecurity companies like CrowdStrike Holdings Inc. (NASDAQ: CRWD), Zscaler Inc. (NYSE: ZS), Datadog Inc. (NASDAQ: DDOG) and Palo Alto Networks Inc. (NASDAQ: PANW).
Selling Fire Extinguishers During a Rain Storm
Cybersecurity services are like buying fire extinguishers. They are a preventative measure and a defensive expense for companies. When the economy is strong, companies have little problem buying them. But, when the macroeconomic landscape gets more challenging, companies scrutinize expenses and trim down in areas that aren’t contributing to the top and bottom lines.
Cybersecurity protection won't directly help grow revenues for customers' businesses, but the downside of not having cybersecurity can be crippling. Fear drives the cybersecurity business. For SentinelOne, this impacts its ability to upsell services and continue its hypergrowth trajectory. The concerns have been reflected in its stock. SentinelOne shares have tumbled from a high of $78.53 in November 2021 to a new low of $12.43 in June 2023.
Missing Expectations
On June 1, 2023, Sentinel One released its fiscal first-quarter 2024 results for the quarter ending April 2023. The Company reported an earnings-per-share (EPS) loss of (-$0.15) excluding non-recurring items versus consensus analyst estimates for a loss of (-$0.17), a $0.02 beat. Revenues grew 70.5% year-over-year (YoY) to $133.39 million, missing analyst estimates of $136.62 million.
ARR Adjustment
Another contributor to the crushing sell-off was the correction of historical inaccuracies with their revenue recognition. Sentinel One changed its had to correct its accounting methodologies and correct prior inaccuracies, making a one-time adjustment to the average run rate (ARR) of $27 million. The company specializes in endpoint protection services for companies.
CEO Comments
SentinelOne CEO Tomer Weingarten commented, "Macro challenges remained, yet we continued to deliver high growth and margin improvement, demonstrating key strengths across our business. Once again, we're leading the industry with the innovation in AI with our recently launched Purple AI: a one-of-a-kind innovation in cybersecurity that empowers enterprises with unparalleled capabilities to offer a real-time, autonomous response against cyber threats; we are adapting and optimizing to empower enterprises with the best security resources and drive progress toward profitability."
Lowered Guidance
SentinelOne lowered guidance for fiscal Q2 2024 revenues to $141 million versus $152.07 million consensus analyst estimates. It lowered fiscal full-year 2024 revenues of $590 million to $600 million versus $637.63 million consensus analyst estimates.
Slew of Downgrades
The analysts had a field day downgrading S stock on June 2, 2023. BTIG Research downgraded its rating for S from Buy to Neutral. D.A. Davidson cut from a Buy to Neutral and slashed its price target from $22.50 to $13.50. Canaccord Equity cut its rating from a Buy to Hold, cutting its target price from $20 to $14. Stephens cut its rating from Overweight to Equal-Weight and price target from $22 to $15. With so many downgrades, it may have alleviated most selling pressure on shares.
Sentinel One analyst rating and price targets can be found on MarketBeat.
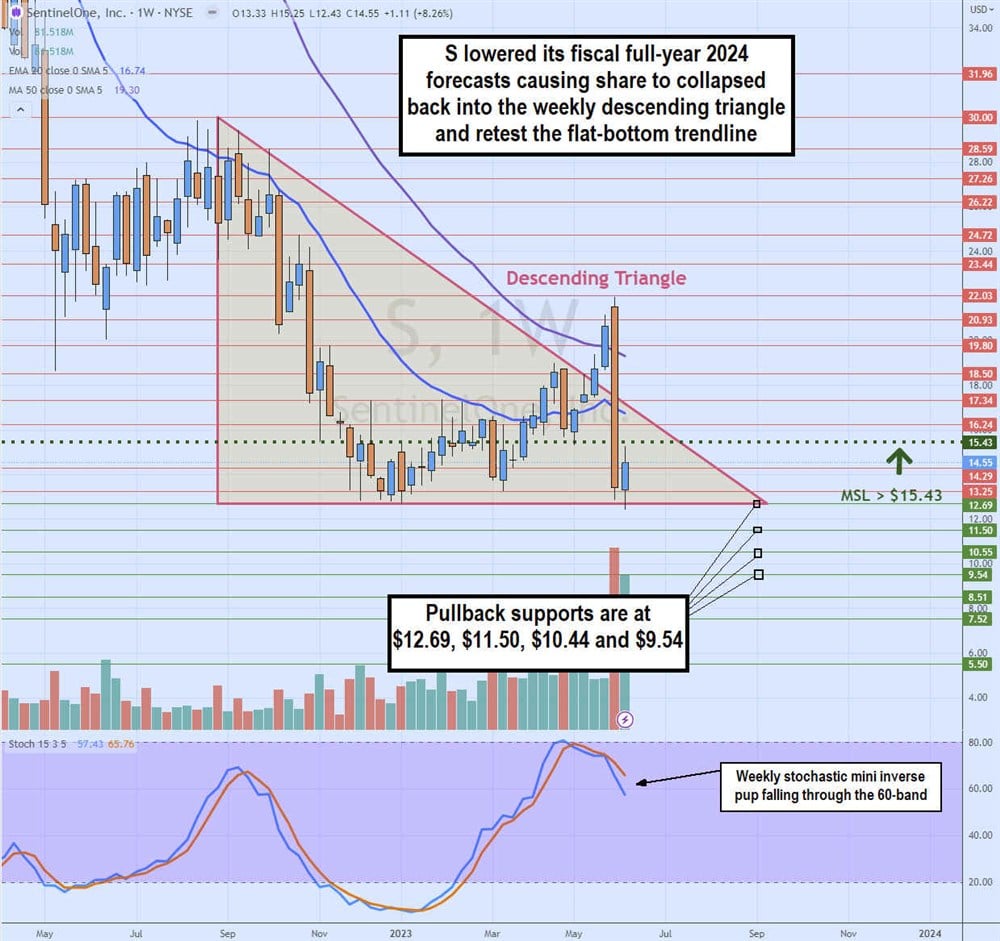
Collapse Back Into the Weekly Descending Triangle
The weekly chart of S formed a descending triangle after peaking at $30.00 in August 2022 and selling off to hit a low of $12.69 in January 2023. S staged a rally on the breakout through the weekly market structure low (MSL) at $15.43. S peaked at the descending trendline resistance at $19.00 in April 2023, causing it to back down to retest and bounce off the weekly MSL trigger support at $15.43.
S was able to rally through the descending trendline in May 2023 to break out to a peak at $22.03 heading into its fiscal Q1 2023 earnings report. S collapsed as it missed guidance and lowered forward guidance punishing shares with a (34%) haircut to retest the flat-bottom triangle trendline at $12.69. The weekly stochastic rejected the 80-band and still falls through the 60-band despite shares attempting to reach the weekly MSL breakout trigger. Pullback supports are at $12.69, $11.50, $10.44 and $9.54.