TORONTO, March 02, 2026 (GLOBE NEWSWIRE) -- NorthWest Copper Corp. (“NorthWest” or the “Company”) (TSX-V: NWST) is pleased to announce an updated mineral resource estimate for the Kwanika Central deposit at its 100% owned Kwanika-Stardust Project, (the “Project”), comprising the Kwanika Central, Kwanika South, and Stardust deposits. NorthWest plans to use the updated Mineral Resource estimate to support an updated Preliminary Economic Assessment (“PEA”) targeted for completion in mid 2026.
Paul Olmsted, CEO of NorthWest, commented: “This updated Mineral Resource Estimate represents a significant milestone for the Company and reinforces our strategy of prioritizing higher-grade copper and gold mineralization at Kwanika. The update is an excellent result, demonstrating a substantial Mineral Resource base from which to develop preliminary open pit and underground mine plans that can support a long mine life. Importantly, the results mark a major step toward our goal of a more capital-efficient, top-down underground mining approach, including sub-level caving and sub-level retreat mining methods. In addition, the significant open pit component should help de-risk the early years of a mine schedule, particularly with the potential for a higher-grade starter pit. With this milestone achieved, our immediate focus shifts to advancing the Project toward completion of a PEA in mid-2026. We believe this next phase of work will further demonstrate the opportunity to deliver a more economically compelling Project relative to the 2023 PEA as we continue to advance Kwanika toward development.”
Highlights Kwanika Central Deposit:
- Indicated Mineral Resource: 16.22 million tonnes (“Mt”) grading 0.63 % Cu, 0.74 g/t Au, 2.0 g/t Ag or 1.27 % CuEq1, for 226.6 million lbs (“Mlbs”) of Cu, 383 thousand ounces of gold and 1,035 thousand ounces of silver.
- Inferred Mineral Resource: 28.97 Mt grading 0.48 % Cu, 0.63 g/t Au, 1.5 g/t Ag or 1.05 % CuEq, for 307.6 Mlbs of Cu, 589 thousand ounces of gold and 1,393 thousand ounces of silver.
- Open Pit Mineral Resources:
- Indicated Mineral Resource: 8.99 Mt grading 0.55 % Cu, 0.51 g/t Au, 1.8 g/t Ag or 0.98 % CuEq, for 109.5 Mlbs of Cu, 148 thousand ounces of gold and 512 thousand ounces of silver.
- Inferred Mineral Resource: 9.18 Mt grading 0.33 % Cu, 0.35 g/t Au, 1.0 g/t Ag or 0.63 % CuEq, for 66.1 Mlbs of Cu, 104 thousand ounces of gold and 300 thousand ounces of silver.
- Underground Sub-Level Cave (“SLC”) Mineral Resources:
- Indicated Mineral Resource: 7.23 Mt grading 0.73 % Cu, 1.01 g/t Au, 2.3 g/t Ag or 1.64 % CuEq, for 117.0 Mlbs of Cu, 235 thousand ounces of gold and 523 thousand ounces of silver.
- Inferred Mineral Resource: 19.8 Mt grading 0.55 % Cu, 0.76 g/t Au, 1.7 g/t Ag or 1.24 % CuEq, for 241.5 Mlbs of Cu, 485 thousand ounces of gold and 1,093 thousand ounces of silver.
- The Mineral Resource estimate for Kwanika Central was supported by verified data, robust geological models, well-defined mineralized zones, constrained by informed open pit shells and underground sub-level cave mining shapes and optimized to support mid-size bulk mining open pit and sub-level cave mining studies.
- Technical sub-studies on metallurgical variability testing and power are now underway to support an updated PEA targeted for completion by mid 2026.
Geoff Chinn, VP Business Development and Exploration added: “The updated Kwanika Central Mineral Resource differs in several important ways from previous estimates. Mineralized zones have been more clearly defined and separated into higher-grade and lower-grade zones, as well as into gold and copper dominant zones, fundamentally re-mapping our understanding of the deposit. We have also recognized that sub-parallel, wide mineralized zones are separated by zones of host rock. Notably, this is the first time Mineral Resources has been disclosed with a top-down sub-level cave mining method in mind. A key feature of sub-level cave Mineral Resources is that all material within the preliminary caving shape is considered without a cut-off grade. To illustrate this, we note that approximately 24% of the sub-level cave volume comprises host rock within the mining envelope. As the Project advances to the PEA stage, a goal will be to manage dilution. Two key initiatives aimed at achieving this goal include advancing higher resolution mine designs and processing technologies like ore sorting, as disclosed in our February 23, 2026, News Release.”
Mineral Resource Overview:
The updated Mineral Resource Estimate for Kwanika Central was prepared by SLR Consulting (Canada) Ltd. (“SLR”) in accordance with the Canadian Institute of Mining and Metallurgy and Petroleum (“CIM”) definitions, as required under National Instrument 43-101 (“NI 43-101”). SLR is independent of NorthWest.
The Mineral Resource Estimates for the Stardust and Kwanika South deposits remain unchanged from those disclosed in the Technical Report entitled “Kwanika-Stardust Project, NI 43-101 Technical Report” with an effective date of January 4, 2023, filed on SEDAR+ on February 17, 2023.
The following is the current Mineral Resource estimate as at February 27, 2026 (the “Effective Date”).
Table 1 Kwanika Central Mineral Resource Summary (as at the Effective Date)
| Category | Tonnes (Mt) | Grade | Contained Metal | |||||
| Cu % | Au (g/t) | Ag (g/t) | CuEq (%) | Cu (Mlbs) | Au (koz) | Ag (koz) | ||
| Indicated | 16.22 | 0.63 | 0.74 | 2.0 | 1.27 | 226.6 | 383 | 1,035 |
| Inferred | 28.97 | 0.48 | 0.63 | 1.5 | 1.05 | 307.6 | 589 | 1,393 |
Notes:
- Mineral Resources are reported in accordance with CIM Definition Standards (2014) incorporated by reference into NI 43-101.
- Mineral Resources are not Mineral Reserves and do not have demonstrated economic viability.
- Reasonable prospects for eventual economic extraction (“RPEEE”) were demonstrated by constraining resources within optimized open pit shells and sub-level cave underground reporting shapes.
- Open pit Mineral Resources are constrained within a preliminary optimized pit shell and reported above a C$24.06/t NSR cut-off.
- Underground Mineral Resources are constrained within sub level cave reporting shapes generated at a C$56.75/t NSR cut-off and reported at a C$0/t cut-off within those shapes.
- Net smelter return (“NSR”) values were calculated on a block-by-block basis using copper, gold, and silver grades and fixed metallurgical recoveries, concentrate characteristics, and smelter terms.
- Metal prices used for the estimate are: US$4.50/lb Cu, US$3,100/oz Au, and US$36.00/oz Ag.
- Metallurgical recoveries applied to sulphide material at Kwanika Central are: 89.6% Cu, 95.5% total Au, and 96.3% total Ag.
- Block model bulk density values were assigned on a zone-by-zone basis using the arithmetic mean of validated density measurements from samples within each mineralized zone. Fixed average density values were assigned to blocks outside mineralized zones.
- Open pit optimization and underground reporting shapes were generated assuming a processing throughput rate of 7,000 tonnes per day and operating costs including mining, processing, sorting, and G&A totaling approximately C$24.06/t processed for open pit and C$56.76/t for sub-level cave mining.
- There are 8.62 Mt of unclassified host rock within the constraining sub level cave shape excluded from this tabulation, which represents potential dilution.
- All prices are in Canadian dollars ($CAD) unless otherwise stated.
- Numbers may not add due to rounding.
Table 2a Breakdown of Open Pit Mineral Resource at Kwanika Central Deposit
| Category | Tonnes (Mt) | Grade | Contained Metal | |||||
| Cu % | Au (g/t) | Ag (g/t) | CuEq (%) | Cu (Mlbs) | Au (koz) | Ag (koz) | ||
| Indicated | 8.99 | 0.55 | 0.51 | 1.8 | 0.98 | 109.5 | 148 | 512 |
| Inferred | 9.18 | 0.33 | 0.35 | 1.0 | 0.63 | 66.1 | 104 | 300 |
Notes:
- Mineral Resources are reported in accordance with CIM Definition Standards (2014) incorporated by reference into NI 43-101.
- Mineral Resources are not Mineral Reserves and do not have demonstrated economic viability.
- Reasonable prospects for eventual economic extraction (“RPEEE”) were demonstrated by constraining resources within optimized open pit shells
- Open pit Mineral Resources are constrained within a preliminary optimized pit shell and reported above a C$24.06/t NSR cut-off.
- Net smelter return (“NSR”) values were calculated on a block-by-block basis using copper, gold, and silver grades and fixed metallurgical recoveries, concentrate characteristics, and smelter terms.
- Metal prices used for the estimate are: US$4.50/lb Cu, US$3,100/oz Au, and US$36.00/oz Ag.
- Metallurgical recoveries applied to sulphide material at Kwanika Central are: 89.6% Cu, 95.5% total Au, and 96.3% total Ag.
- Block model bulk density values were assigned on a zone-by-zone basis using the arithmetic mean of validated density measurements from samples within each mineralized zone. Fixed average density values were assigned to blocks outside mineralized zones.
- Open pit optimization was generated assuming a processing throughput rate of 7,000 tonnes per day and operating costs, including mining, processing, sorting, and G&A, totaling approximately C$24.06/t processed for open pit mining.
- All prices are in Canadian dollars ($CAD) unless otherwise stated.
- Numbers may not add due to rounding.
Table 2b Breakdown of Sub-Level Cave Mineral Resource at Kwanika Central Deposit
| Category | Tonnes (Mt) | Average Grade | Contained Metal | |||||
| Cu % | Au (g/t) | Ag (g/t) | CuEq (%) | Cu (Mlbs) | Au (koz) | Ag (koz) | ||
| Indicated | 7.23 | 0.73 | 1.01 | 2.3 | 1.64 | 117.0 | 235 | 523 |
| Inferred | 19.80 | 0.55 | 0.76 | 1.7 | 1.24 | 241.5 | 485 | 1,093 |
Notes:
- Mineral Resources are reported in accordance with CIM Definition Standards (2014) incorporated by reference into NI 43-101.
- Mineral Resources are not Mineral Reserves and do not have demonstrated economic viability.
- Reasonable prospects for eventual economic extraction (“RPEEE”) were demonstrated by constraining the underground resource within sub-level cave reporting shapes.
- Underground Mineral Resources are constrained within sub level cave reporting shapes generated at a C$56.75/t NSR cut-off and reported at a C$0/t cut-off within those shapes.
- Net smelter return (“NSR”) values were calculated on a block-by-block basis using copper, gold, and silver grades and fixed metallurgical recoveries, concentrate characteristics, and smelter terms.
- Metal prices used for the estimate are: US$4.50/lb Cu, US$3,100/oz Au, and US$36.00/oz Ag.
- Metallurgical recoveries applied to sulphide material at Kwanika Central are: 89.6% Cu, 95.5% total Au, and 96.3% total Ag.
- Block model bulk density values were assigned on a zone-by-zone basis using the arithmetic mean of validated density measurements from samples within each mineralized zone. Fixed average density values were assigned to blocks outside mineralized zones.
- Underground reporting shapes were generated assuming a processing throughput rate of 7,000 tonnes per day and operating costs including mining, processing, sorting, and G&A, totalling approximately C$56.76/t for sub-level cave mining.
- There are 8.62 Mt of unclassified host rock within the constraining sub level cave shape excluded from this tabulation, which represents potential dilution.
- All prices are in Canadian dollars ($CAD) unless otherwise stated.
- Numbers may not add due to rounding.
Dilution in the Mineral Resources
For underground sub-level caving methods, Mineral Resources are constrained within conceptual mining shapes developed using an NSR cut-off of C$56.76/t to demonstrate reasonable prospects for eventual economic extraction. At Kwanika Central, all Indicated and Inferred material contained within the resulting sub-level cave reporting shapes is included in the Mineral Resource, with no additional cut-off applied within the shapes. This reporting approach reflects the inherent inclusion of internal dilution (“must take” material) within the mineralized zones associated with the mining method.
Additional host rock located within the conceptual sub-level cave mining envelope but outside the mineralized zones is also noted for transparency and represents potential additional dilution inherent to the mining method.
More detailed mine design and processing studies will be required to quantify dilution and to assess the potential impact of ore sorting work recently reported by the Company. To provide additional transparency, Table 2b notes the tonnage of poorly mineralized host rock contained within the SLC reporting shapes.
Property
The 35,700 ha Kwanka-Stardust project is 100% owned and is located 150 km north of Fort St. James in the Omineca Mining Division of north-central British Columbia.
Geology
The Kwanika Central and South deposits are located along the western margin of the Quesnel Terrane, a Late Paleozoic to Early Jurassic island arc that hosts numerous calc-alkalic to alkalic Cu-Au porphyry deposits including the Copper Mountain mine, Mount Milligan mine and New Afton Cu-Au mines, the giant Highland Valley Cu-Mo mine, and NorthWest Copper’s Lorraine – Top Cat Cu-Au-Ag±PGE porphyry project.
Kwanika geology is dominated by Jurassic intrusions that are part of the Hogem batholith, to which Kwanika mineralization is related, emplaced into favourable Triassic Takla Group volcanic rocks. The Kwanika hydrothermal system and the Hogem intrusions are truncated on their west side by the Pinchi fault, a regional-scale dextral strike-slip structure. Mineral resources at Kwanika are hosted at the Central deposit with additional mineral potential in and around the Central and South deposit areas.
The Stardust deposit is located only 7 km northwest of the Kwanika Central deposit. It is hosted by the Late Paleozoic Cache Creek Terrane, which occurs west of the Pinchi Fault. Mineralization at Stardust deposit is related to the Eocene Glover Stock, a multiphase felsic intrusion emplaced into Cache Creek limestones and clastic sedimentary rocks. Stardust is a high-grade Cu-Au carbonate replacement deposit (CRD, including skarn).
Stardust occurs in one part of a 2.2 km long corridor that exhibits classic CRD zoning progressing from the northwest to the southeast through:
- Proximal Cu-Mo porphyry mineralization in the Glover Stock
- High-grade Cu-Au resources in the 421 Zone and overlying Canyon Creek Zone skarns that replaced limestone and calcareous sedimentary rocks along the eastern margin of the Glover stock
- Zn-Pb-Ag mantos and chimneys in the 4b, No. 3 and No. 2 Manto Zones
- Peripheral Ag-Au epithermal mineralization in the No.1 Ag-Au ±Zn±Cu Vein Zone
The Kwanika Central, Kwanika South and Stardust deposits together comprise the Kwanika-Stardust project.
Data Verification
The data used in the Kwanika Mineral Resource estimate is supported by Quality Assurance and Quality Control (“QA/QC”) procedures, such as the insertion of certified standards and blanks into the sample stream and the utilization of certified independent analytical laboratories for all assays. The QA/QC data and methodology on the project were reviewed and will be summarized in the NI 43-101 technical report.
Daniel Grabiec, P.Geo. of Explore Geosolutions, an independent Qualified Person in accordance with the requirements of NI 43-101 reviewed the adequacy of sample preparation, security, QA/QC programs and analytical procedures conducted by NorthWest from the start of the 2022 Kwanika drill programs through to the Effective Date. They also actively monitored the QA/QC program in 2025. This review found no material issues or inconsistencies that could adversely affect the quality or reliability of the data. The Explore Geosolutions QP is of the opinion that:
- NorthWest’s sample preparation procedures are appropriate for the deposit type and mineralization style.
- Analytical methods used, including fire assay, and screen fire assay, are suitable for determining gold grades in the Project.
- The QA/QC program, which includes CRMs, blanks, and duplicates, is well-structured, meets industry standards, and provides confidence in the assay data.
- Sample security measures and chain of custody protocols are sufficient to ensure the integrity of the data.
April Barrios, P.Geo. of SLR, an independent Qualified Person in accordance with the requirements of NI 43-101, is of the opinion that NorthWest’s sampling, analytical methods, and QA/QC program meet industry standards and are suitable for use in the Mineral Resource estimate.
Data verification for the drill hole database included comparing gold assay values used to support the Mineral Resource estimate against the original analytical certificates from Acme, ActLabs, AGAT, ALS, Bureau Veritas, and Teck’s Global Discovery Lab, the primary laboratories used by NorthWest between 2006 and 2025. The review covered a variety of assay methods, including multi-element ICP, fire assay with AAS, ICP or gravimetric finish.
SLR found no material discrepancies that would impact the validity of the Mineral Resource estimate. SLR’s QP is of the opinion that the verification process confirms the reliability of the assay database, ensuring its suitability for use for Mineral Resource estimation.
In accordance with NI 43-101, April Barrios, P.Geo., of SLR, conducted a site visit to the Project and related facilities on October 15 and 16, 2025. During this visit, she inspected the Kwanika Central deposit drill sites, the core shack, and reviewed the logging environment and procedures for data collection and sampling. She also examined core samples from Kwanika Central deposit. In addition, she interviewed NorthWest’s personnel and consultants and gathered information necessary for completing the Mineral Resource estimate and accompanying Technical Report.
Ms. Barrios also inspected drill collars and drill hole cores relevant to the Mineral Resource estimation, verifying collar locations using a handheld GPS and visually comparing mineralization with interpreted drilling sections. NorthWest provided full access to all facilities and personnel during the visit. Ms. Barrios was accompanied by Geoff Chinn, VP Business Development and Exploration of NorthWest.
Mineral Resource Estimation Methodology
At the Kwanika Central deposit, sixteen mineralized zones were defined by NWST as follows:
- Continuous gold zones were correlated based on values above 0.7g/t Au only.
- Continuous copper-gold zones were correlated based on values above 0.7% CuEq based on straight metal price conversions.
- Low-grade zones were correlated based on values above 0.4% CuEq
- Late cross-cutting dykes within the mineralized were correlated based on gold values below 0.125g/t Au.
Assay caps were applied on a zone-by-zone basis prior to compositing. Two metre fixed length-weighted composites were used for the interpolation of grades into the block model using inverse distance squared (ID2) interpolation and compared against nearest neighbor (NN) via swath plots and tables for consistency. High-grade search restrictions were implemented within certain zones. A sub-blocked model was created using a 5 m parent cell size with 2.5 m sub block increments to accurately reproduce the wireframe volumes. Block model bulk density values were assigned on a zone-by-zone basis using the arithmetic mean of validated density measurements from samples collected within each mineralized zone. Fixed average bulk density values were assigned to blocks outside the mineralized zones.
MRE classification was based primarily on closest three-hole spacings of up to approximately 35 m (nominal 50 m regular drill spacing) for Indicated Mineral Resources and up to approximately 70 m (nominal 100 m regular drill spacing) for Inferred Mineral Resources, which were applied to create continuous classification categories.
Figure 1: Oblique view of the Mineral Resource pit and sublevel-cave shapes
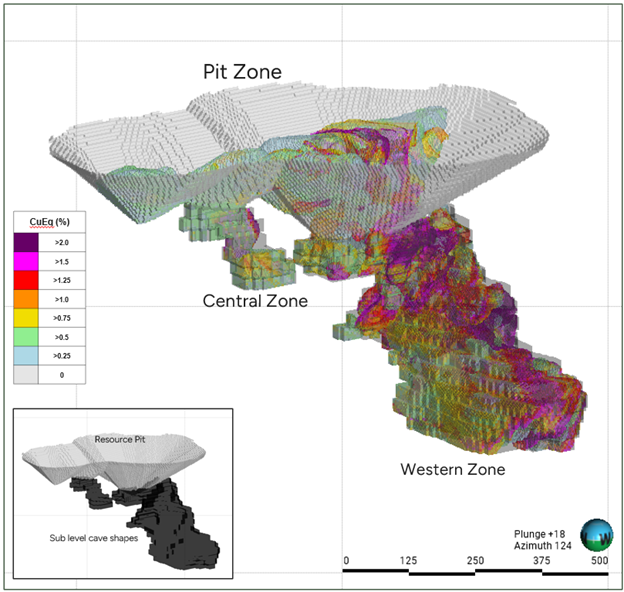
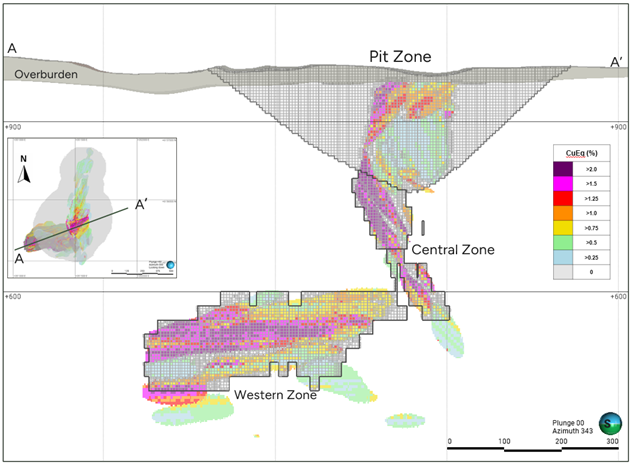
Figure 2: Kwanika Central Deposit Looking Northwest
Metallurgy
For processing, material was ground to a primary grind P80 of approximately 53 microns using conventional ball mills. The majority of the copper mineralization floated quickly, while mineralization with slower kinetics was treated separately in a dedicated bulk flotation circuit. Treating the two different mineralogy’s separately, significantly improved the metallurgical response, while allowing flexibility in the flowsheet. Approximately 89.6% of the copper mineralization was recovered to concentrates. The downstream process included leaching of the float tailings, which increased overall gold extraction in the central zone to over 95%. Reagent consumption during the leach was decreased relative to the previous work as the residual copper content was low. This in turn, allowed the process to use standard tailings treatment processes.
Based on recent test work and project experience, Canenco recommended the following concentrate characteristics, smelter terms and tailing leach parameters to be used in the Mineral Resource estimate:
| Metallurgical Recoveries | Unit | Values |
| Copper | % | 89.6 |
| Gold in Cu | % | 76.3 |
| Gold in Dore | % | 19.2 |
| Gold Total | % | 95.5 |
| Silver in Cu | % | 79.9 |
| Silver in Dore | % | 16.4 |
| Silver Total | % | 96.3 |
| Metal | Unit | Price | |
| Cu | US$/lb | $4.50 | |
| Ag | US$/oz | $36.00 | |
| Au | US$/oz | $3,100 | |
| Concentrate Grades | Unit | Values |
| Copper concentrate | %Cu | 24.5 |
| g/t Au | 40.3 | |
| g/t Ag | 71.6 |
| Copper Concentrate Marketing | Unit | Values |
| Concentrate moisture | % | 9 |
| Transportation (Port/Port Charges/Ocean) | US$/wmt | 269.20 |
| Marketing fee/insurance | % deduction | NA |
| Smelter treatment charge | US$/dmt | 21.25 |
| Copper payable | % | 96.5 |
| Copper refining charge | US$/lb payable | 0.02125 |
| min Copper deduction | % deduction | 1 |
| Gold payable | % | 97 |
| min Gold payable | g/t in Conc | 1 |
| Gold refining charge | US$/oz payable | 5.00 |
| Silver payable | % | 90 |
| min Silver payable | g/t in Conc | 30 |
| Silver refining charge | US$/oz payable | 0.50 |
| Ag/Au Leach - Dore Marketing | Unit | Values |
| Transportation | US$/oz payable | 10.00 |
| Gold payable | % | 99.5 |
| Gold refining charge | US$/oz payable | 5.00 |
| Silver payable | % | 99 |
| Silver refining charge | US$/oz payable | 0.50 |
Net smelter return (“NSR”) values were calculated on a block-by-block basis using copper, gold, and silver block grades with the input parameters listed in the tables above. For NSR and CuEq calculations, fixed smelter terms, and recovery values are applied to all blocks within each zone as provided below.
Kwanika Central:
CAD_NSR = (([CU] * (82.46-12.3558)) + ([AU]*92.8704) + ([AG]*0.42))/0.74
CUEQ = ([CAD_NSR] * 0.74) / (4.51*22.046*0.896)
Mining Constraints/RPEEE Shapes
Blocks were constrained by open pit shells and sub-level cave underground mining shapes at a base case mining scenario to demonstrate RPEEE at an NSR cut-off of $24.06/t for open pit and $56.75/t for sub-level caving. The cut-off grades were selected using cost estimates listed in the table below that assume: a processing throughput rate of 7,000 tonnes-per-day (tpd).
| Operating Costs | Unit | Values | |
| Mining costs (OP) | CAD$/t mined | $5.12 | |
| Mining costs (SLC) | CAD$/t mined | $32.70 | |
| Sorting costs | CAD$/t ROM ore | $1.19 | |
| Process costs | CAD$/t ROM ore | $17.71 | |
| G&A costs | CAD$/t ROM ore | $5.15 | |
| Process + Sorting+ G&A Costs | CAD$/t ROM ore | $24.06 | |
Reasonable prospects of eventual economic extraction (“RPEEE”) were demonstrated for the reported Mineral Resource estimate by constraining the open pit material within preliminary optimized pit shells, while the underground material was constrained within sub-level cave shapes.
Open pit Mineral Resource estimates were reported above a C$24.06/t NSR reporting cut-off value, whereas sub-level cave Mineral Resource estimates were reported at a C$0/t NSR cut-off.
At Kwanika Central, for the purposes of open pit and underground RPEEE mining shape optimization, the estimated block model was re-blocked to 5 m by 5 m by 5 m and reported within a sub-blocked model with 5 m by 5 m by 5 m parent cells with 2.5m sub-blocks.
Technical Report
A technical report will be prepared (the “Technical Report”) by Qualified Persons in accordance with the requirements of NI 43-101 and will be filed on SEDAR+ within 45 days of the date of this press release.
Readers are cautioned that the conclusions, projections and estimates set out in this press release are subject to important qualifications, assumptions and exclusions, all of which will be detailed in the Technical Report. To fully understand the summary information set out in this press release, the Technical Report, which will be filed on SEDAR+ at www.sedarplus.ca, should be read in its entirety.
Qualified Person Statements
The 2026 MRE for the Kwanika Central deposit was prepared by April Barrios, P.Geo. of SLR, an independent Qualified Person in accordance with the requirements of NI 43-101, who has reviewed and approved the contents of this news release.
Metallurgical parameters for the Kwanika Central deposit provided by Stacy Freudigmann P.Eng., F.Aus.IMM, CEO of Canenco Consulting Corp. an independent Qualified Person in accordance with the requirements of NI 43-101, who has reviewed and approved the contents of this news release.
RPEEE Underground mining shapes constraining the MRE for the Kwanika Central deposit were prepared under the supervision of Jarek Jakubec, C.Eng, FIMMM, Corporate Consultant SRK Consulting (Canada) Inc., who has reviewed and approved the contents of this news release. The open pit resource pit shells were developed by Dr. Anoush Ebrahimi P.Eng, Principal Consultant from SRK Consulting (Canada) Inc., who has reviewed and approved the contents of this news release.
Assay analytical procedures and Quality Assurance and Quality Control (“QA/QC”) performance provided by Daniel Grabiec, P.Geo. of Explore Geosolutions, an independent Qualified Person in accordance with the requirements of NI 43-101 who has reviewed and approved the contents of this news release.
Technical aspects of this news release have been reviewed, verified, and approved by Geoff Chinn, P.Geo., VP Business Development and Exploration for NorthWest, a qualified person as defined by National Instrument 43-101 – Standards of Disclosure for Minerals Projects.
About NorthWest:
NorthWest is a copper-gold exploration and development company with a pipeline of advanced and early-stage projects in British Columbia, including Kwanika-Stardust, Lorraine-Top Cat and East Niv. With a robust portfolio in an established mining jurisdiction, NorthWest is well positioned to participate fully in strengthening global copper and gold markets. The Company is committed to responsible mineral exploration, working collaboratively with First Nations to help ensure future development incorporates stewardship best practices and respects traditional land use. Additional information can be found on the Company’s website at www.northwestcopper.ca.
On Behalf of NorthWest
“Paul Olmsted”
CEO, NorthWest Copper
For further information, please contact:
416-457-3333
info@northwestcopper.ca
Neither the TSXV nor its Regulation Services Provider (as that term is defined in the policies of the TSX Venture Exchange) accepts responsibility for the adequacy or accuracy of this release.
Cautionary Statement Regarding Forward-Looking Information
This news release contains “forward-looking information” within the meaning of applicable securities laws. All statements, other than statements of historical fact, are forward-looking statements and are based on expectations, estimates and projections as at the date of this news release. Any statement that involves discussion with respect to predictions, expectations, beliefs, plans, projections, objectives, assumptions, future events or performance (often, but not always using phrases such as “plans”, “expects”, “is expected”, “budget”, “scheduled”, “estimates”, “forecasts”, “intends”, “anticipates”, or “believes” or variations (including negative variations) of such words and phrases, or state that certain actions, events or results “may”, “could”, “would”, “might” or “will” be taken, occur or be achieved) are not statements of historical fact and may be forward-looking statements. In this news release, forward-looking statements relate, among other things, to statements with respect to; plans and intentions of the Company; proposed exploration and development of NorthWest’s exploration property interests; the Company’s ability to finance future operations; mine plans; magnitude or quality of mineral deposits; the development, operational and economic results of current and future potential economic studies; the Company’s goals for 2026; geological interpretations; the estimation of Mineral Resources; anticipated advancement of mineral properties or programs; future exploration prospects; the completion and timing of technical reports; future growth potential of NorthWest; and future development plans.
All statements, other than statements of historical fact, included herein, constitutes forward-looking information. Although NorthWest believes that the expectations reflected in such forward-looking information and/or information are reasonable, undue reliance should not be placed on forward-looking information since NorthWest can give no assurance that such expectations will prove to be correct. Forward-looking information involves known and unknown risks, uncertainties and other factors that may cause actual results or events to differ materially from those anticipated in such forward-looking information, including the risks, uncertainties and other factors identified in NorthWest’s periodic filings with Canadian securities regulators. Forward-looking information are subject to business and economic risks and uncertainties and other factors that could cause actual results of operations to differ materially from those contained in the forward-looking information. Important factors that could cause actual results to differ materially from NorthWest’s expectations include risks associated with the business of NorthWest; risks related to reliance on technical information provided by NorthWest; risks related to exploration and potential development of the Company’s mineral properties; business and economic conditions in the mining industry generally; fluctuations in commodity prices and currency exchange rates; uncertainties relating to interpretation of drill results and the geology, continuity and grade of mineral deposits; the need for cooperation of government agencies and First Nation groups in the exploration and development of properties and the issuance of required permits; the need to obtain additional financing to develop properties and uncertainty as to the availability and terms of future financing; the possibility of delay in exploration or development programs and uncertainty of meeting anticipated program milestones; uncertainty as to timely availability of permits and other governmental approvals; and other risk factors as detailed from time to time and additional risks identified in NorthWest’s filings with Canadian securities regulators on SEDAR+ in Canada (available at www.sedarplus.com).
Forward-looking information is based on estimates and opinions of management at the date the information is made. NorthWest does not undertake any obligation to update forward-looking information except as required by applicable securities laws. Investors should not place undue reliance on forward-looking information.
1 CuEq – Defined under Metallurgy section
Photos accompanying this announcement are available at
https://www.globenewswire.com/NewsRoom/AttachmentNg/d71f9a3e-7559-460c-89b6-5961ba27bbcc
https://www.globenewswire.com/NewsRoom/AttachmentNg/d4f2a382-44f3-46e9-a202-0b0ad95e392b

![]()