While the two disciplines don’t seem to have much in common with each other, options trading in some respects very much operates like the game of football. Based on how the offense lines up, the chosen formation will structurally lean the flow of play toward a particular direction or route. Similarly, specific sequences in stock pricing behavior can make certain outcomes more likely than others.
As a basic example, if the offense lines up in a shotgun formation, chances are pretty high — especially if it’s late in the fourth quarter and the team with the ball is behind — that the next play is going to be a pass. If the defense looks for other clues about what could be coming, the defensive backfield could jump the route, potentially leading to an interception.
In my opinion, the same philosophy works for the financial markets. When a security has suffered an extended period of selling pressure, new information must often be introduced to justify more downturns. Without such info, it will be harder for beaten-down securities to continue their descent. As such, these red-stained entities may be ripe for a reversal.
In more complicated terms, the stock market operates by the Markov property; that is, the future state of a system depends only on the current state. Basically, these three stocks that I’m going to discuss below have been beaten up over the last several weeks — and they’re going to respond differently than if they had enjoyed a long series of upswings.
Essentially, the thesis is that, because of the market downgrade, these securities may reflexively bounce higher due to increased value perception. The difference here is that we’ll use empirical data to guide our trading decisions rather than narrative scaffoldings.
Hewlett Packard Enterprise (HPE)
Hewlett Packard Enterprise (HPE) has not had a great start to the new year, already losing roughly 8%. Still, HPE stock carries a Weak Buy rating from the Barchart Technical Opinion indicator and I would say for good reason. While the overall performance hasn’t been all that impressive compared to other tech entities, Hewlett Packard in the long run should benefit from its infrastructural specialties, with AI being a compelling growth area.
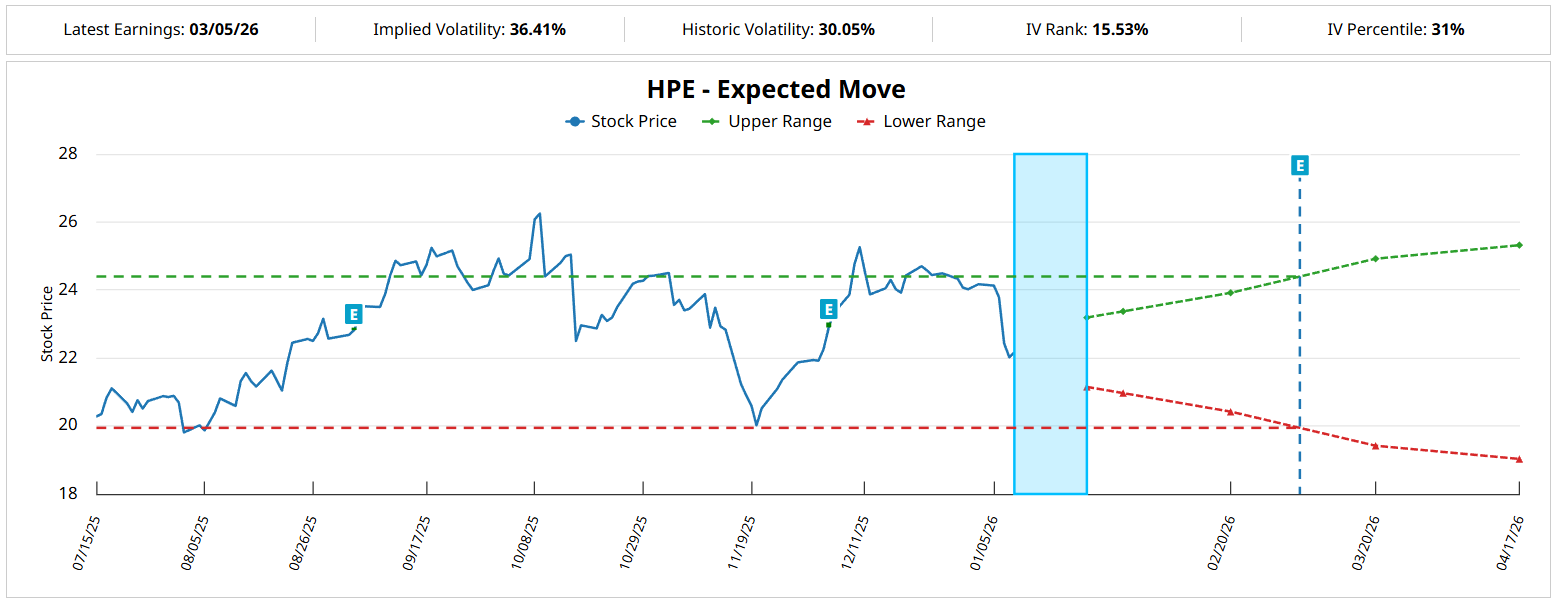
From a hierarchical perspective, a random 10-week position held in HPE stock would likely land somewhere between $22.15 and $22.50 (assuming a spot price of $22.17, Friday’s close). Over many trials, probability density would peak between $22.25 and $22.31.
However, we’re not interested in trading HPE stock as an aggregate behavior. Rather, we’re looking at the statistical response to the current quantitative setup. In the last 10 weeks, HPE printed only four up weeks, leading to an overall downward slope. Under this 4-6-D (four up, six down, downward trend) sequence, the forward 10-week returns would likely range between $21.50 and $23.50.
To be fair, probability density would likely peak at $22.35. However, most of the probability mass will cluster north of the spot price, making HPE stock an intriguing idea for a controlled vertical spread.
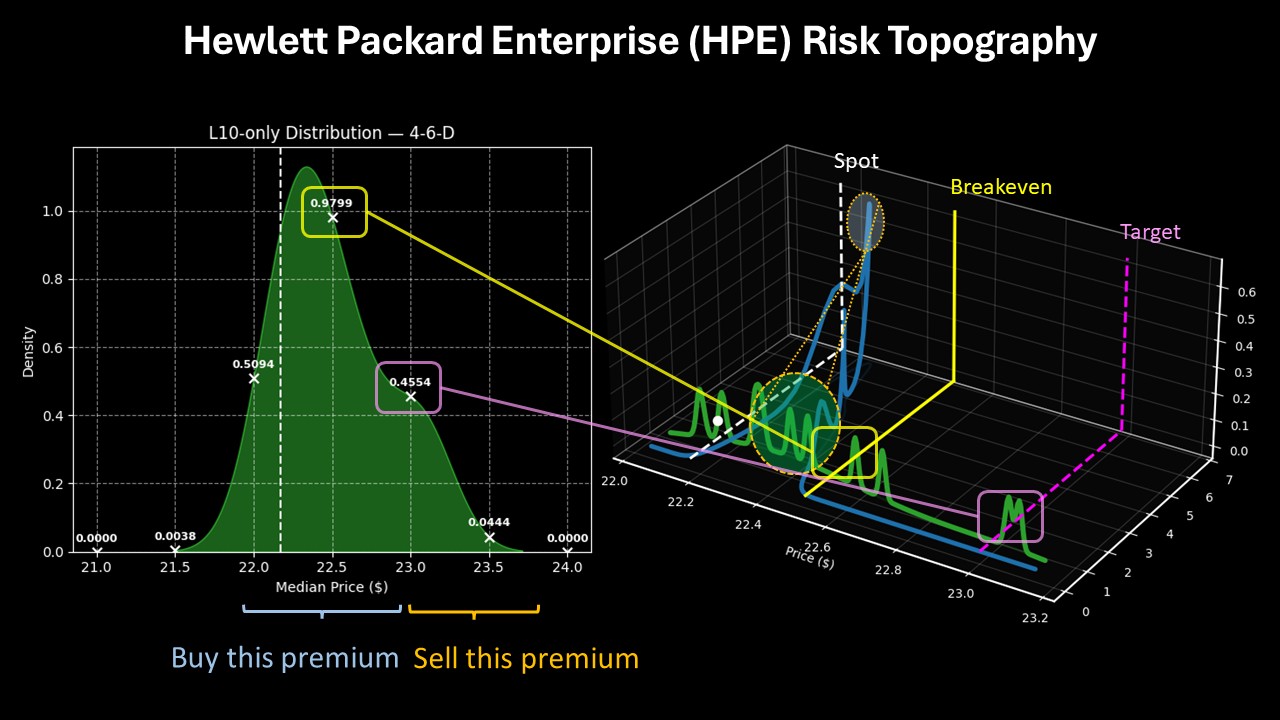
Referencing the trading data acquired from Barchart Premier, I’m looking at the 22/23 bull call spread expiring Feb. 20, 2026. Should HPE stock rise through the second-leg strike, the maximum payout would be 96%. Breakeven comes in at $22.51, adding credibility to this trade.
Snowflake (SNOW)
Snowflake (SNOW) has ranked among the more solid tech enterprises over the past 52 weeks, with SNOW stock gaining nearly 35%. However, recent performances have been lackluster. In the past six months, the security has gained a little over 2%. To start off this year, it’s down about 1%. That said, the cloud-based data platform company should see its fortunes turn thanks to its relevant business.
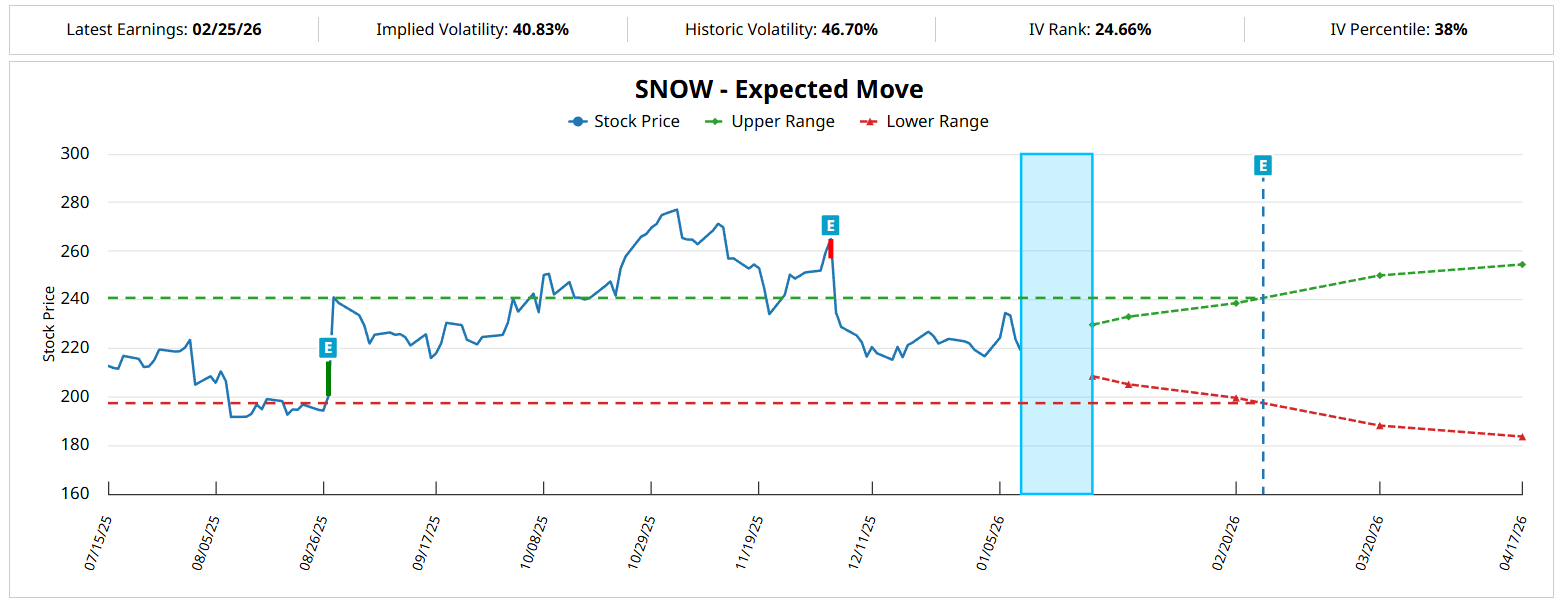
In analyzing SNOW stock from a hierarchical lens, its forward 10-week returns would likely range between $217 and $226 (assuming a spot price of $219.09). Probability density would likely peak at around $222 over many trials, thus demonstrating a modestly positive bias over a fixed-time distribution.
Of course, we’re not looking at trading SNOW stock as an aggregate behavior but specifically for its response to the current quant signal. Right now, SNOW is structured in a 4-6-D formation, which would typically lead to forward 10-week outcomes ranging between $205 and $245. Probability density would likely peak at around $228.
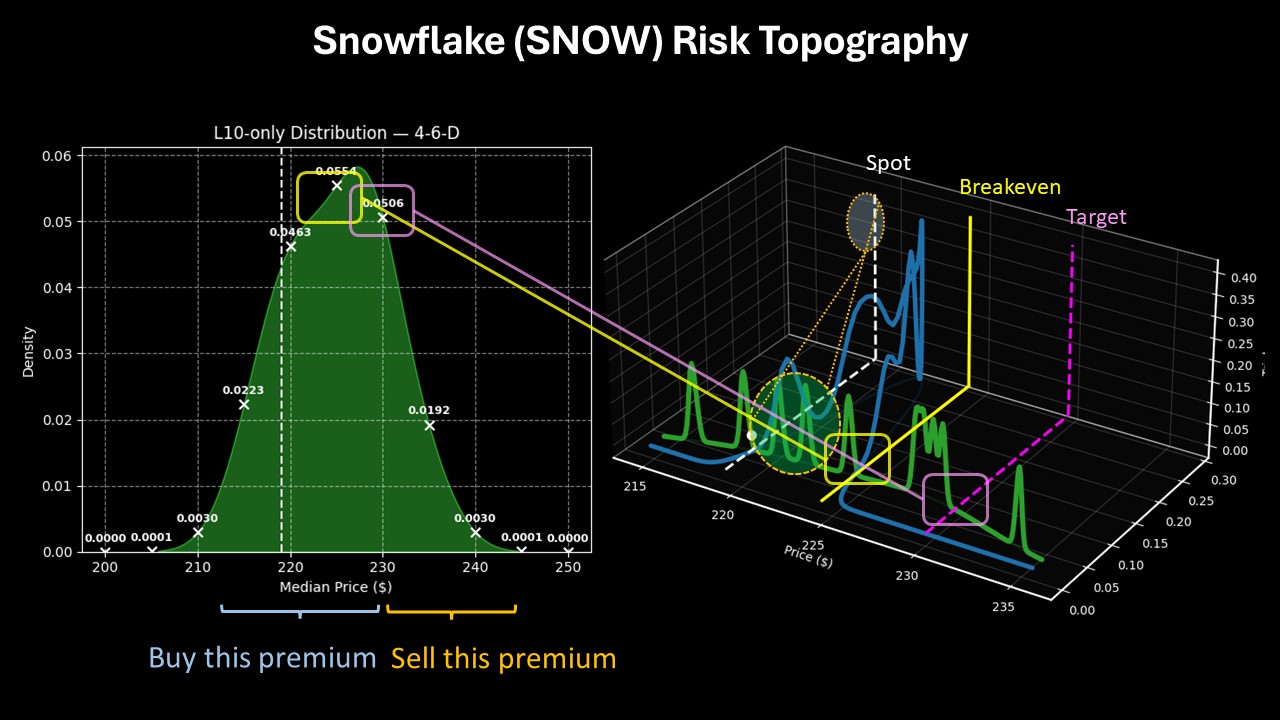
What’s notable here is that the penalty in probability decay is quite limited between $225 and $230, where density will likely only decline by 8.66%. But between $230 and $235, this metric would fall to over 62%. From an opportunity cost perspective, then, I’m really liking the 220/230 bull spread expiring Feb. 20.
If fully triggered, max payout stands at almost 125%. Breakeven comes in at $224.45.
CrowdStrike (CRWD)
CrowdStrike (CRWD) also hasn’t enjoyed the most auspicious start to the new year, down half-a-percent. In the trailing month, CRWD stock fell more than 9%, reflecting concerns in the cybersecurity space. Despite the volatility, the fundamentals offer significant relevance. While generative AI has done wonders in terms of improving productivity, it can also be used for nefarious purposes — especially in the area of data breaches.
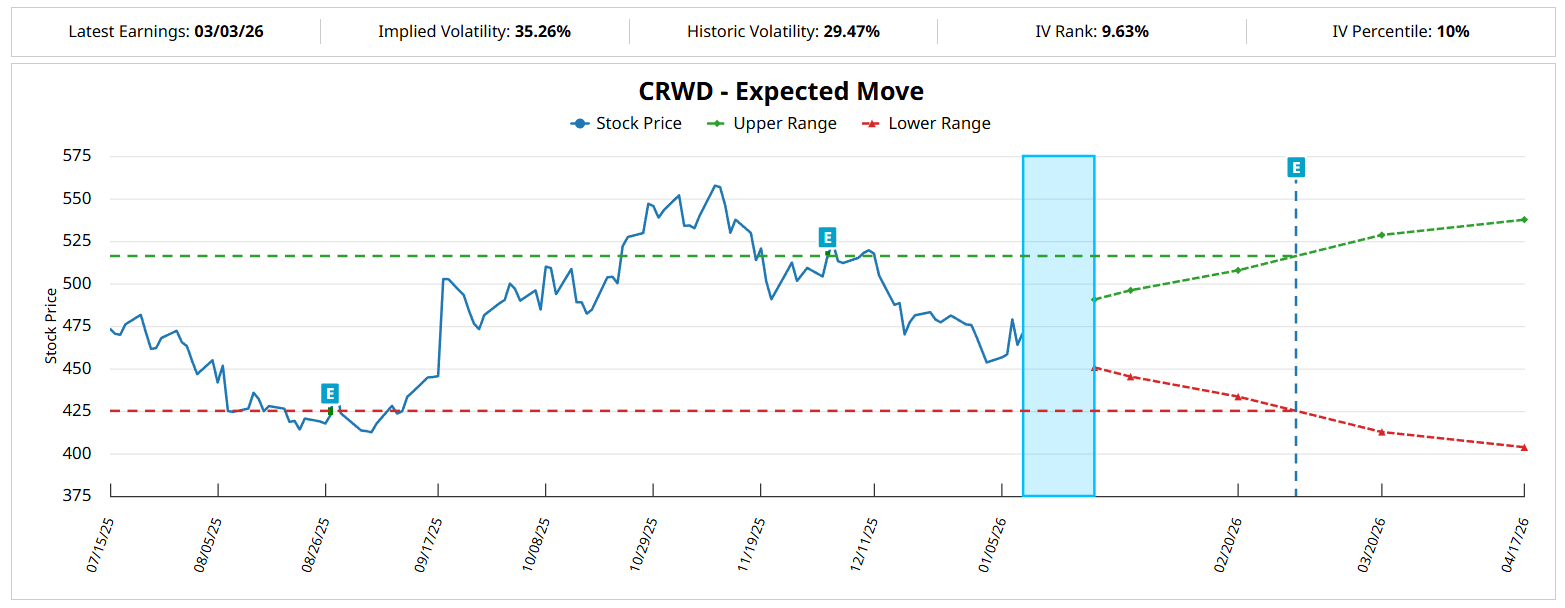
With that in mind, it’s difficult to see downturns in CRWD stock as anything other than an eventual upside opportunity. From a hierarchical perspective, CRWD’s forward 10-week returns would typically land between $450 and $550 (assuming a spot price of $470.61). Further, probability density would likely peak at $500.
Again, we’re not interested in trading CRWD stock as an aggregate behavior. Instead, we’re looking strictly at the current quant signal, which is structured in a 4-6-D formation. Under this setup, the stock’s forward returns would likely range between $430 and $570, with probability density likely to be predominant at $520.
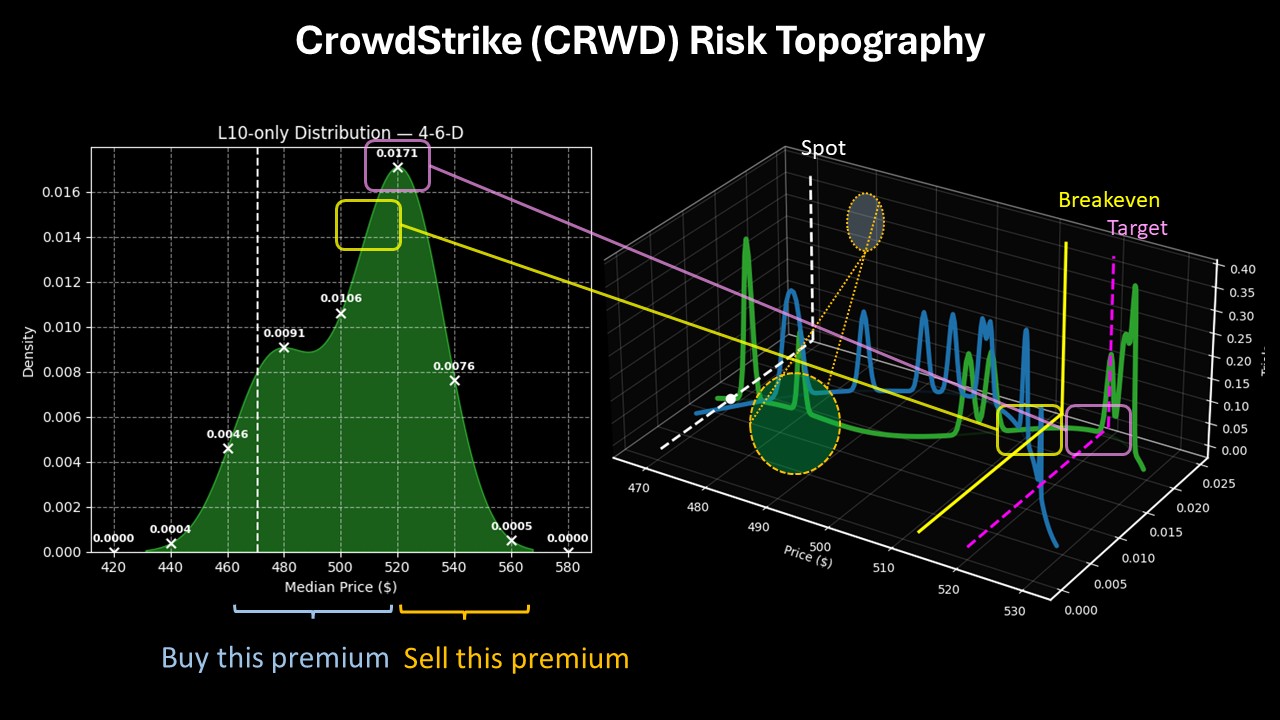
Not only that, probability decay accelerates sharply beyond $520, which means that we can also cap our exposure to an opportunity cost with a vertical spread. I’m looking at the 510/520 bull spread expiring Feb. 20. Max payout lands at over 292%, with breakeven coming in at $512.55.
On the date of publication, Josh Enomoto did not have (either directly or indirectly) positions in any of the securities mentioned in this article. All information and data in this article is solely for informational purposes. For more information please view the Barchart Disclosure Policy here.
More news from Barchart
- The Saturday Spread: Reading the Market’s Signals to Jump Ahead of the Crowd (HPE, SNOW, CRWD)
- Unusual Options Activity in Pfizer: 2 Strategies Traders Are Jumping On
- Microsoft Stock Is Trading in a Range - Shorting Out-of-the-Money Puts Works
- Follow the Smart Money: 2 Undervalued Stocks With Aggressive Share Buybacks and Unusual Options Activity